 CA
 NZ
 UK
 AU
 IND

 US


…
Genprex, Inc., a clinical-stage gene therapy company, focuses on developing therapies for patients with cancer and diabetes. The company's technologies are designed to administer disease-fighting genes to provide new therapies for patient populations with cancer and diabetes. Its oncology program utilizes its systemic, non-viral Oncoprex Delivery System, which encapsulates the gene-expressing plasmids using lipid-based nanoparticles in a lipoplex form. The company's lead product candidate, Reqorsa Immunogene Therapy (quaratusugene ozeplasmid), is being evaluated in three clinical trials as a treatment for NSCLC and SCLC. Its three-lung cancer clinical programs have received a Fast Track Designation from the FDA for the treatment of that patient population, and SCLC program has received an FDA Orphan Drug Designation. The company's diabetes gene therapy comprises of a novel infusion process that uses an AAV vector to deliver Pdx1 and MafA genes directly to the pancreas. In models of Type 1 diabetes, its GPX-002 transforms alpha cells in the pancreas into functional beta-like cells, which produce insulin but distinct enough from beta cells to evade the body's immune system; and GPX-002 for Type 2 diabetes, where autoimmunity is not at play, is believed to rejuvenate and replenish exhausted beta cells. It has research agreement with The University of Michigan Rogel Cancer Center and Lung Cancer Study Collaboration with ALK Positive. Genprex, Inc. was incorporated in 2009 and is based in Austin, Texas.
Source: TradingView
The charts and visual representations are sourced from TradingView through embedded widgets. For any issues with chart display, please visit the TradingView website
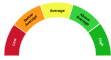
A unique technical analysis driven score developed by Kalkine showing momentum in stock prices based on select technical indicators identified.


| Breakdown | 2025-12-31 | 2024-12-31 | 2023-12-31 | 2022-12-31 | 2021-12-31 |
|---|---|---|---|---|---|
| Type | yearly | yearly | yearly | yearly | yearly |
| Date | 2025-12-31 | 2024-12-31 | 2023-12-31 | 2022-12-31 | 2021-12-31 |
| Income before tax | -16.23M | -21.11M | -30.86M | -23.74M | -19.60M |
| Net income | -16.23M | -21.11M | -30.86M | -29.46M | -19.59M |
| Selling general administrative | 6.09M | 10632.03M | 13.44M | 12.30M | 10.97M |
| Selling and marketing expenses | - | 10621.40M | 13.43M | - | - |
| Gross profit | - | -0.01M | -0.02M | -23.83M | - |
| Reconciled depreciation | 0.00M | 0.01M | 0.02M | 0.03M | 0.02M |
| Ebit | - | -21.11M | -31.08M | -23.83M | -19.60M |
| Ebitda | -15.49M | -21.10M | -31.06M | -23.81M | -19.58M |
| Depreciation and amortization | - | 0.01M | 0.02M | 0.03M | 0.02M |
| Operating income | -15.52M | -21.17M | -31.08M | -23.83M | -19.60M |
| Other operating expenses | 15.52M | 21.17M | 31.08M | 23.83M | 19.60M |
| Interest expense | 0.74M | 0.00M | - | 18.11M | 0.01M |
| Interest income | - | 0.06M | 0.23M | 0.09M | 0.01M |
| Net interest income | -0.74M | 0.06M | 0.23M | 0.09M | 0.01M |
| Income tax expense | - | -21367.17M | -0.00M | 5.72M | -0.01M |
| Total revenue | 0.00M | 0.00M | 0.00M | 0.00M | 0.00M |
| Total operating expenses | 15.52M | 21.17M | 31.06M | 23.83M | 19.60M |
| Cost of revenue | - | 0.01M | 0.02M | 23.83M | - |
| Total other income expense net | -0.71M | 0.06M | 0.22M | 0.09M | 0.01M |
| Net income from continuing ops | -16.23M | -21.11M | -31.45M | -23.74M | -19.60M |
| Net income applicable to common shares | - | - | - | - | -19.60M |
| Breakdown | 2025-12-31 | 2024-12-31 | 2023-12-31 | 2022-12-31 | 2021-12-31 |
|---|---|---|---|---|---|
| Type | yearly | yearly | yearly | yearly | yearly |
| Date | 2025-12-31 | 2024-12-31 | 2023-12-31 | 2022-12-31 | 2021-12-31 |
| Total assets | 10.16M | 4.12M | 10.67M | 25.09M | 42.86M |
| Intangible assets | - | - | 0.77M | 0.70M | 0.64M |
| Other current assets | 0.53M | 0.48M | 0.79M | 0.48M | 0.51M |
| Total liab | 2.20M | 2.50M | 3.25M | 2.81M | 1.59M |
| Total stockholder equity | 7.96M | 1.62M | 7.42M | 22.27M | 41.28M |
| Other current liab | 1.43M | 1.43M | 1.86M | 2.37M | 0.61M |
| Common stock | 0.00M | 0.01M | 0.00M | 0.05M | 0.05M |
| Capital stock | 0.00M | 0.01M | 0.00M | 0.05M | 0.05M |
| Retained earnings | -171.03M | -154.80M | -133.69M | -102.83M | -78.02M |
| Other assets | - | 0.00M | 0.00M | - | 3.03M |
| Cash | 7.83M | 1.60M | 6.74M | 20.95M | 38.63M |
| Total current liabilities | 2.17M | 2.50M | 3.25M | 2.81M | 1.59M |
| Net debt | -7.83M | -1.60M | -6.74M | -20.95M | -38.63M |
| Other stockholder equity | 178.99M | 156.41M | 141.10M | 125.05M | 119.25M |
| Property plant equipment | - | - | - | - | 0.05M |
| Total current assets | 8.36M | 2.08M | 7.53M | 21.47M | 39.14M |
| Net tangible assets | - | - | - | - | 40.63M |
| Short term investments | - | 1600.06M | - | - | - |
| Net receivables | - | - | 0.00M | 0.03M | 0.00M |
| Accounts payable | 0.74M | 1.07M | 1.40M | 0.44M | 0.97M |
| Accumulated other comprehensive income | - | - | 0.00M | - | - |
| Non currrent assets other | 1.80M | 2.05M | 2.36M | 2.89M | 3.03M |
| Non current assets total | 1.80M | 2.05M | 3.14M | 3.61M | 3.72M |
| Breakdown | 2025-12-31 | 2024-12-31 | 2023-12-31 | 2022-12-31 | 2021-12-31 |
|---|---|---|---|---|---|
| Type | yearly | yearly | yearly | yearly | yearly |
| Date | 2025-12-31 | 2024-12-31 | 2023-12-31 | 2022-12-31 | 2021-12-31 |
| Investments | - | 0.00M | 0.08M | 0.10M | -0.08M |
| Change to liabilities | - | - | - | 0.00M | 0.78M |
| Total cashflows from investing activities | - | 0.00M | -0.07M | - | -0.08M |
| Total cash from financing activities | 21.54M | 12.01M | 10.59M | 0.01M | 25.68M |
| Change to operating activities | - | - | - | 1.77M | 0.23M |
| Net income | -16.23M | -21.11M | -30.86M | -23.74M | -19.60M |
| Change in cash | 6.23M | -5.14M | -14.22M | -17.67M | 11.31M |
| Begin period cash flow | 1.60M | 6.74M | 20.95M | 38.63M | 27.32M |
| End period cash flow | 7.83M | 1.60M | 6.74M | 20.95M | 38.63M |
| Total cash from operating activities | -15.31M | -17.15M | -24.74M | -17.78M | -14.28M |
| Issuance of capital stock | 21.54M | 12.01M | 10.60M | 0.01M | 25.68M |
| Depreciation | 0.00M | 0.01M | 0.02M | 0.03M | 0.02M |
| Other cashflows from investing activities | - | 0.00M | 0.00M | 0.00M | 0.00M |
| Dividends paid | - | 277.12M | - | - | - |
| Change to account receivables | - | 0.00M | 0.03M | -0.03M | 0.00M |
| Other cashflows from financing activities | 21.54M | 277.12M | -0.07M | 0.10M | -0.08M |
| Change to netincome | - | - | - | 4.73M | 4.28M |
| Capital expenditures | 0.00M | 0.00M | 0.07M | 0.06M | 0.08M |
| Change in working capital | -0.14M | -0.12M | 0.70M | 1.20M | 1.01M |
| Stock based compensation | 0.31M | 3.30M | 5.41M | 4.73M | 4.28M |
| Other non cash items | 0.74M | 0.77M | 0.99M | -0.00M | -6.28M |
| Free cash flow | -15.31M | -17.15M | -24.81M | -17.84M | -14.37M |
Sector: Healthcare Industry: Biotechnology
|
Stock Name
|
Change
(USD) |
Price
(USD) |
Trailing
PE (x) |
Forward
PE (x) |
Price Sales
TTM (x) |
Price to Book Value (x)
|
Enterprise Value
to EBITDA (x) |
|---|---|---|---|---|---|---|---|
| GNPX Genprex Inc |
-0.17 7.36% |
2.14 | - | - | - | 1.32 | 0.18 |
| NVO Novo Nordisk A/S |
1.99 4.95% |
42.18 | 41.58 | 31.15 | 2.13 | 32.99 | 4.70 |
| VRTX Vertex Pharmaceuticals Inc |
18.28 3.44% |
549.04 | 30.22 | 24.27 | 10.36 | 6.50 | 24.66 |
| REGN Regeneron Pharmaceuticals Inc |
-41.91 4.31% |
931.45 | 29.07 | 20.12 | 7.57 | 3.82 | 19.42 |
| ARGNF argenx SE |
- -% |
900.30 | 45.77 | 31.25 | 13.84 | 7.12 | 36.06 |
Genprex, Inc., a clinical-stage gene therapy company, focuses on developing therapies for patients with cancer and diabetes. The company's technologies are designed to administer disease-fighting genes to provide new therapies for patient populations with cancer and diabetes. Its oncology program utilizes its systemic, non-viral Oncoprex Delivery System, which encapsulates the gene-expressing plasmids using lipid-based nanoparticles in a lipoplex form. The company's lead product candidate, Reqorsa Immunogene Therapy (quaratusugene ozeplasmid), is being evaluated in three clinical trials as a treatment for NSCLC and SCLC. Its three-lung cancer clinical programs have received a Fast Track Designation from the FDA for the treatment of that patient population, and SCLC program has received an FDA Orphan Drug Designation. The company's diabetes gene therapy comprises of a novel infusion process that uses an AAV vector to deliver Pdx1 and MafA genes directly to the pancreas. In models of Type 1 diabetes, its GPX-002 transforms alpha cells in the pancreas into functional beta-like cells, which produce insulin but distinct enough from beta cells to evade the body's immune system; and GPX-002 for Type 2 diabetes, where autoimmunity is not at play, is believed to rejuvenate and replenish exhausted beta cells. It has research agreement with The University of Michigan Rogel Cancer Center and Lung Cancer Study Collaboration with ALK Positive. Genprex, Inc. was incorporated in 2009 and is based in Austin, Texas.
| Name | Title | Year Born |
|---|---|---|
| Mr. John Rodney Varner | Co-Founder, Chairman, Pres & CEO | 1957 |
| Mr. Ryan M. Confer M.S. | Chief Financial Officer | 1982 |
| Ms. Catherine M. Vaczy Esq. | Exec. VP, Gen. Counsel, Corp. Sec. & Chief Strategy Officer | 1961 |
| Dr. Hemant Kumar C.P.M., EMBA, Ph.D. | Chief Manufacturing & Technology Officer | 1963 |
| Ms. Kalyn Dabbs | Sr. Mang. of Communications & Marketing | NA |
| Mr. David M. Schloss | Sr. VP of HR | NA |
| Mr. Thomas C. Gallagher Esq. | Sr. VP of Intellectual Property & Licensing | NA |
| Dr. William E. Gannon Jr. | Member of Clinical Advisory Board & VP of Regulatory Affairs | NA |
| Dr. Mark S. Berger M.D. | Chief Medical Officer | 1955 |
| Mr. Greg Jancarik C.M.A., CPA, M.B.A. | Corp. Controller | NA |
Disclaimer - (*)This information, including any data, is sourced from Unicorn Data Services SAS, trading as EOD Historical Data (“EODHD”) on an ‘as is’ basis, using their API. We cannot guarantee the completeness or validity of the information and data provided on this page, as well as via the API. In some cases, the data may include analyst ratings or recommendations sourced through the EODHD API, which are intended solely for general information purposes.
This information does not consider your personal objectives, financial situation, or needs. Kalkine is not liable for any errors or omissions in the information provided or for any actions taken in reliance on it. You should seek advice from a financial adviser, stockbroker or other professional adviser (including taxation and legal advice) as necessary before acting on this information.

Download a free report with stock ideas and industry insights for general information.
Download Free Report Now →


Basic Materials
 +2.10%
Communication Services
+1.48%

Consumer Cyclical
+2.12%

Consumer Defensive
+1.59%

Energy
 -2.52%

Financial Services
+1.11%
Financials
-6.05%

Healthcare
+2.12%

Industrials
-0.12%

Real Estate
+1.25%

Technology
-0.07%

Utilities
+0.57%
Note: Daily price change (%) by sector excluding stocks with +/-90% daily price change. Companies above $500 million market capitalization are considered.
 Portfolio
 Watchlist


 Please wait processing your request...