 CA
 NZ
 UK
 AU
 IND

 US


…
OPKO Health, Inc., a healthcare company, engages in the diagnostics and pharmaceuticals businesses in the United States, Ireland, Spain, Chile, Israel, Mexico, and internationally. The company's Diagnostics segment operates BioReference Laboratories that offers laboratory testing services for the detection, diagnosis, evaluation, monitoring, and treatment of diseases, including esoteric testing, molecular diagnostics, anatomical pathology, genetics, women's health, and correctional healthcare to physician offices, clinics, hospitals, employers, and governmental units; and 4Kscore prostate cancer test. Its Pharmaceutical segment offers Rayaldee to treat secondary hyperparathyroidism in adults with stage 3 or 4 chronic kidney disease, and vitamin D insufficiency. This segment also develops multi-specific immune therapies focused on oncology, infectious diseases, vaccines, and immunology; OPK88004, an orally administered selective androgen receptor modulator; OPK88003, a once-weekly administered peptide for the treatment of type 2 diabetes and related obesity; Somatrogon (hGH-CTP), a once-weekly human growth hormone injection; and Factor VIIa-CTP, a novel long-acting coagulation factor being developed to treat hemophilia. In addition, it develops and commercializes longer-acting proprietary versions of already approved therapeutic proteins; develops and produces specialty APIs; develops, manufactures, markets, and sells pharmaceutical, nutraceutical, veterinary, and ophthalmic products; commercializes food supplements and over the counter products; manufactures and sells products primarily in the generics market; and markets, distributes, and sells pharmaceutical products in a range of indications, including cardiovascular products, vaccines, antibiotics, gastro-intestinal products, hormones, and others. The company also operates pharmaceutical platforms in Ireland, Chile, Spain, and Mexico. The company was founded in 2007 and is headquartered in Miami, Florida.
Source: TradingView
The charts and visual representations are sourced from TradingView through embedded widgets. For any issues with chart display, please visit the TradingView website
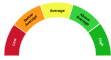
A unique technical analysis driven score developed by Kalkine showing momentum in stock prices based on select technical indicators identified.


| Breakdown | 2022-12-31 | 2021-12-31 | 2020-12-31 | 2019-12-31 | 2018-12-31 |
|---|---|---|---|---|---|
| Type | yearly | yearly | yearly | yearly | yearly |
| Date | 2022-12-31 | 2021-12-31 | 2020-12-31 | 2019-12-31 | 2018-12-31 |
| Income before tax | -391.50M | -14.00M | 48.70M | -304.90M | -177.20M |
| Net income | -328.00M | -29.50M | 30.60M | -312.00M | -153.00M |
| Selling general administrative | 372.67M | 468.90M | 355.57M | 343.31M | 358.35M |
| Gross profit | 288.20M | 581.50M | 541.00M | 329.40M | 385.70M |
| Reconciled depreciation | 108.66M | 50.30M | 85.36M | 93.81M | 97.34M |
| Ebit | -246.20M | -47.70M | 57.70M | -196.60M | -161.20M |
| Ebitda | -178.30M | 2.60M | 106.10M | -54.30M | -93.30M |
| Depreciation and amortization | 67.90M | 50.30M | 48.40M | 142.30M | 67.90M |
| Non operating income net other | - | -14.53M | 12.90M | -9.40M | -8.68M |
| Operating income | -246.20M | -47.70M | 57.70M | -196.60M | -171.20M |
| Other operating expenses | 1250.40M | 1789.20M | 1381.70M | 1098.50M | 1156.50M |
| Interest expense | 12.06M | 18.88M | 21.93M | 21.52M | 11.89M |
| Tax provision | -63.50M | 15.50M | 17.62M | 7.06M | -38.73M |
| Interest income | 1.98M | 0.03M | 0.15M | 1.71M | 1.24M |
| Net interest income | -10.07M | -18.85M | -21.78M | -19.81M | -10.65M |
| Non recurring | - | -31.51M | - | 92.40M | 21.78M |
| Income tax expense | -63.50M | 15.50M | 17.60M | 7.10M | -38.70M |
| Total revenue | 1004.20M | 1774.70M | 1435.40M | 901.90M | 990.30M |
| Total operating expenses | 534.40M | 596.00M | 487.30M | 526.00M | 551.90M |
| Cost of revenue | 716.00M | 1193.20M | 894.40M | 572.50M | 604.60M |
| Total other income expense net | -145.30M | 33.70M | -9.00M | -108.30M | -11.00M |
| Net income from continuing ops | -328.40M | -30.10M | 31.07M | -312.02M | -138.54M |
| Net income applicable to common shares | -328.40M | -30.10M | 30.59M | -314.93M | -138.54M |
| Breakdown | 2023-12-31 | 2022-12-31 | 2021-12-31 | 2020-12-31 | 2019-12-31 |
|---|---|---|---|---|---|
| Type | yearly | yearly | yearly | yearly | yearly |
| Date | 2023-12-31 | 2022-12-31 | 2021-12-31 | 2020-12-31 | 2019-12-31 |
| Total assets | 2011.70M | 2167.30M | 2399.70M | 2473.10M | 2309.30M |
| Intangible assets | 935.28M | 790.90M | 1110.80M | 1270.80M | 1262.10M |
| Other current assets | 17.70M | 241.30M | 373.30M | 451.00M | 238.50M |
| Total liab | 622.48M | 605.70M | 714.60M | 801.50M | 694.50M |
| Total stockholder equity | 1389.22M | 1561.60M | 1685.10M | 1671.60M | 1614.80M |
| Other current liab | 85.88M | 143.40M | 190.93M | 222.65M | 142.97M |
| Common stock | 7.82M | 7.81M | 6.90M | 6.71M | 6.70M |
| Capital stock | 7.82M | 7.81M | 6.90M | 6.71M | 6.70M |
| Retained earnings | -2011.79M | -1822.92M | -1511.98M | -1481.83M | -1511.08M |
| Other liab | - | 126.40M | 196.70M | 204.00M | 153.82M |
| Good will | 598.26M | 595.85M | 520.60M | 680.60M | 671.94M |
| Other assets | - | 981.90M | 465.90M | 653.73M | 7.01M |
| Cash | 95.88M | 153.20M | 134.70M | 72.21M | 85.45M |
| Total current liabilities | 200.05M | 213.50M | 301.80M | 375.50M | 249.10M |
| Current deferred revenue | 1.38M | - | 0.26M | 15.78M | 19.20M |
| Net debt | 230.68M | 60.30M | 53.20M | 149.79M | 125.75M |
| Short term debt | 43.12M | 3.10M | 28.58M | 36.18M | 24.40M |
| Short long term debt | 27.29M | 36.59M | 14.70M | 24.70M | 9.62M |
| Short long term debt total | 326.56M | 213.50M | 187.90M | 222.00M | 211.20M |
| Other stockholder equity | 3431.22M | 3420.03M | 3220.67M | 3150.95M | 3141.24M |
| Property plant equipment | - | - | 123.95M | 178.29M | 166.49M |
| Total current assets | 309.48M | 394.50M | 823.00M | 523.20M | 324.00M |
| Long term investments | 16.08M | 28.05M | 10.73M | 15.73M | 20.75M |
| Net tangible assets | - | 770.70M | 574.30M | 515.95M | 413.86M |
| Short term investments | - | - | - | -0.01M | 0.05M |
| Net receivables | 130.20M | 148.61M | 265.59M | 302.26M | 157.69M |
| Long term debt | 222.03M | 219.47M | 187.90M | 225.83M | 259.86M |
| Inventory | 65.70M | 74.06M | 86.50M | 132.34M | 53.43M |
| Accounts payable | 69.68M | 67.00M | 82.04M | 100.88M | 62.54M |
| Accumulated other comprehensive income | -38.03M | -43.32M | -30.50M | -4.22M | -22.07M |
| Common stock total equity | - | - | 6.90M | 6.71M | 6.70M |
| Retained earnings total equity | - | - | -1511.98M | -1481.83M | -1511.08M |
| Treasury stock | - | - | -1.79M | -1.79M | -1.79M |
| Non currrent assets other | -185.92M | 832.24M | 465.90M | 679.10M | 723.20M |
| Non current assets total | 1702.22M | 1772.80M | 1576.70M | 1949.90M | 1985.30M |
| Capital lease obligations | 77.24M | 49.49M | 49.90M | 44.05M | 46.49M |
| Long term debt total | - | - | - | - | 263.91M |
| Breakdown | 2022-12-31 | 2021-12-31 | 2020-12-31 | 2019-12-31 | 2018-12-31 |
|---|---|---|---|---|---|
| Type | yearly | yearly | yearly | yearly | yearly |
| Date | 2022-12-31 | 2021-12-31 | 2020-12-31 | 2019-12-31 | 2018-12-31 |
| Investments | 91.04M | 6.08M | 15.11M | -1.20M | 0.52M |
| Change to liabilities | 0.00M | -44.57M | 118.99M | 16.40M | -24.37M |
| Total cashflows from investing activities | - | 35.95M | -18.33M | -13.27M | -26.12M |
| Net borrowings | - | -11.43M | -35.83M | 99.19M | 47.24M |
| Total cash from financing activities | 22.97M | -10.35M | -35.08M | 175.25M | 140.91M |
| Change to operating activities | - | -29.64M | 98.70M | -10.38M | 4.22M |
| Net income | -328.40M | -30.14M | 30.59M | -314.93M | -153.04M |
| Change in cash | 18.48M | 62.50M | -13.24M | -11.02M | 4.97M |
| Begin period cash flow | 134.71M | 72.21M | 85.45M | 96.47M | 91.50M |
| End period cash flow | 153.19M | 134.71M | 72.21M | 85.45M | 96.47M |
| Total cash from operating activities | -95.19M | 38.34M | 39.48M | -172.52M | -109.14M |
| Issuance of capital stock | - | 0.00M | 0.00M | 76.06M | 92.50M |
| Depreciation | 108.66M | 78.72M | 85.36M | 93.81M | 97.34M |
| Other cashflows from investing activities | - | 62.03M | 0.24M | 0.67M | 1.22M |
| Change to inventory | 13.66M | 30.68M | -77.64M | -12.13M | 4.59M |
| Change to account receivables | 128.60M | 5.23M | -150.44M | 7.38M | 20.40M |
| Sale purchase of stock | - | - | - | 76.06M | 93.67M |
| Other cashflows from financing activities | 837.08M | 1685.61M | 1108.62M | 487.31M | 83.09M |
| Change to netincome | - | 9.29M | 19.91M | 104.76M | 11.04M |
| Capital expenditures | 24.58M | 32.16M | 33.68M | 12.74M | 27.86M |
| Change receivables | - | 5.23M | -150.44M | 7.38M | 20.40M |
| Cash flows other operating | - | -11.66M | 11.86M | -68.80M | -65.29M |
| Exchange rate changes | - | - | - | - | -0.68M |
| Cash and cash equivalents changes | - | 63.94M | -13.93M | -10.54M | 4.97M |
| Change in working capital | 42.65M | -20.48M | -97.61M | -68.81M | -58.14M |
| Stock based compensation | 18.51M | 13.63M | 8.95M | 13.42M | 21.76M |
| Other non cash items | 137.80M | -13.54M | -3.45M | 99.66M | 18.07M |
| Free cash flow | -119.77M | 6.18M | 5.79M | -185.26M | -137.00M |
Sector: Healthcare Industry: Diagnostics & Research
|
Stock Name
|
Change
(USD) |
Price
(USD) |
Trailing
PE (x) |
Forward
PE (x) |
Price Sales
TTM (x) |
Price to Book Value (x)
|
Enterprise Value
to Revenue (x) |
Enterprise Value
to EBITDA (x) |
|---|---|---|---|---|---|---|---|---|
| OPK Opko Health Inc |
- -% |
1.66 | - | 64.52 | 0.99 | 0.62 | 1.26 | -16.61 |
| TMO Thermo Fisher Scientific Inc |
-12.18 1.72% |
697.00 | 34.71 | 23.87 | 4.62 | 4.43 | 5.29 | 20.89 |
| DHR Danaher Corporation |
-4.75 2.00% |
232.23 | 29.09 | 28.01 | 5.67 | 3.20 | 6.00 | 19.09 |
| WUXIF WuXi AppTec Co. Ltd |
- -% |
23.25 | 22.29 | 17.95 | 1.53 | 5.98 | 8.39 | 14.30 |
| WUXAY WuXi AppTec Co. Ltd |
-0.73 3.01% |
23.56 | 23.28 | 18.73 | 1.51 | 6.24 | 8.39 | 14.30 |
OPKO Health, Inc., a healthcare company, engages in the diagnostics and pharmaceuticals businesses in the United States, Ireland, Spain, Chile, Israel, Mexico, and internationally. The company's Diagnostics segment operates BioReference Laboratories that offers laboratory testing services for the detection, diagnosis, evaluation, monitoring, and treatment of diseases, including esoteric testing, molecular diagnostics, anatomical pathology, genetics, women's health, and correctional healthcare to physician offices, clinics, hospitals, employers, and governmental units; and 4Kscore prostate cancer test. Its Pharmaceutical segment offers Rayaldee to treat secondary hyperparathyroidism in adults with stage 3 or 4 chronic kidney disease, and vitamin D insufficiency. This segment also develops multi-specific immune therapies focused on oncology, infectious diseases, vaccines, and immunology; OPK88004, an orally administered selective androgen receptor modulator; OPK88003, a once-weekly administered peptide for the treatment of type 2 diabetes and related obesity; Somatrogon (hGH-CTP), a once-weekly human growth hormone injection; and Factor VIIa-CTP, a novel long-acting coagulation factor being developed to treat hemophilia. In addition, it develops and commercializes longer-acting proprietary versions of already approved therapeutic proteins; develops and produces specialty APIs; develops, manufactures, markets, and sells pharmaceutical, nutraceutical, veterinary, and ophthalmic products; commercializes food supplements and over the counter products; manufactures and sells products primarily in the generics market; and markets, distributes, and sells pharmaceutical products in a range of indications, including cardiovascular products, vaccines, antibiotics, gastro-intestinal products, hormones, and others. The company also operates pharmaceutical platforms in Ireland, Chile, Spain, and Mexico. The company was founded in 2007 and is headquartered in Miami, Florida.
| Name | Title | Year Born |
|---|---|---|
| Dr. Phillip Frost Ph.D. | Chairman & CEO | 1936 |
| Dr. Jane H. Hsiao M.B.A., MBA, Ph.D. | Vice Chairman & Chief Technical Officer | 1947 |
| Mr. Adam E. Logal | Sr. VP, CFO, Chief Accounting Officer & Treasurer | 1978 |
| Mr. Steven D. Rubin Esq., J.D. | Exec. VP of Admin. & Director | 1960 |
| Dr. Jon R. Cohen M.D. | Advisor | 1955 |
| Dr. Elias Adam Zerhouni M.D. | Pres & Vice Chairman | 1951 |
| Dr. Arie Gutman | Pres of API | 1954 |
| Mr. James DeMarco | Sr. VP of Pharmaceutical Sales | NA |
| Dr. Akhtar Ashfaq | Sr. VP of Clinical R&D and Medical Affairs | NA |
| Ms. Jane Pine Wood Esq., J.D. | Chief Legal Officer of Bio-Reference Laboratories | 1963 |
Disclaimer - (*)This information, including any data, is sourced from Unicorn Data Services SAS, trading as EOD Historical Data (“EODHD”) on an ‘as is’ basis, using their API. We cannot guarantee the completeness or validity of the information and data provided on this page, as well as via the API. In some cases, the data may include analyst ratings or recommendations sourced through the EODHD API, which are intended solely for general information purposes.
This information does not consider your personal objectives, financial situation, or needs. Kalkine is not liable for any errors or omissions in the information provided or for any actions taken in reliance on it. You should seek advice from a financial adviser, stockbroker or other professional adviser (including taxation and legal advice) as necessary before acting on this information.

Download a free report with stock ideas and industry insights for general information.
Download Free Report Now →


Basic Materials
 -1.82%
Communication Services
-0.22%

Consumer Cyclical
-0.13%

Consumer Defensive
 +0.32%

Energy
+0.15%

Financial Services
-0.85%
Financials
+2.34%

Healthcare
-1.28%

Industrials
-0.96%

Real Estate
-0.38%

Technology
-2.73%

Utilities
-0.31%
Note: Daily price change (%) by sector excluding stocks with +/-90% daily price change. Companies above $500 million market capitalization are considered.
 Portfolio
 Watchlist


 Please wait processing your request...