 CA
 NZ
 UK
 AU
 IND

 US


…
Oruka Therapeutics, Inc., a clinical-stage biopharmaceutical company, focuses on developing novel monoclonal antibody therapeutics for psoriasis (PsO), and other inflammatory and immunology (I&I) indications. Its lead products include ORKA-001 that targets p19 subunit of interleukin-23, which is in phase 2a trial for the treatment of PsO; and ORKA-002 that targets interleukin-17A and interleukin-17F, which is in phase 2 trial for the treatment of PsO, psoriatic arthritis, and other conditions. The company also develops ORKA-003 for targeting an undisclosed pathway; and ORKA-021, a sequential combination regimen of ORKA-002 and ORKA-001. Oruka Therapeutics, Inc. is headquartered in Menlo Park, California.
Source: TradingView
The charts and visual representations are sourced from TradingView through embedded widgets. For any issues with chart display, please visit the TradingView website
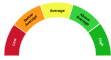
A unique technical analysis driven score developed by Kalkine showing momentum in stock prices based on select technical indicators identified.


| Breakdown | 2025-12-31 | 2024-12-31 | 2023-12-31 | 2022-12-31 | 2021-12-31 |
|---|---|---|---|---|---|
| Type | yearly | yearly | yearly | yearly | yearly |
| Date | 2025-12-31 | 2024-12-31 | 2023-12-31 | 2022-12-31 | 2021-12-31 |
| Income before tax | -105.43M | -83.72M | -5.34M | -9.93M | -19.32M |
| Net income | -105.43M | -83.72M | -5.34M | -9.93M | -19.32M |
| Selling general administrative | 21.41M | - | - | - | - |
| Gross profit | -0.08M | -0.03M | -0.11M | -0.11M | -0.09M |
| Reconciled depreciation | 0.08M | - | - | - | - |
| Ebit | -105.43M | -82.26M | -5.34M | -9.93M | -19.32M |
| Ebitda | -105.35M | -82.23M | -5.23M | -9.81M | -19.23M |
| Depreciation and amortization | 0.08M | 0.03M | 0.11M | 0.11M | 0.09M |
| Operating income | -122.05M | -88.12M | -7.30M | -9.84M | -19.34M |
| Other operating expenses | 122.05M | 88.12M | 7.30M | 9.84M | 19.34M |
| Interest expense | 0.00M | 1.47M | - | - | - |
| Interest income | 16.63M | - | - | - | - |
| Net interest income | 16.63M | - | - | - | - |
| Total revenue | 0.00M | - | - | - | - |
| Total operating expenses | 121.97M | 88.10M | 7.18M | 9.73M | 19.24M |
| Cost of revenue | 0.08M | 0.03M | 0.11M | 0.11M | 0.09M |
| Total other income expense net | 16.62M | 4.40M | 1.96M | -0.09M | 0.01M |
| Net income from continuing ops | -105.43M | - | - | - | - |
| Breakdown | 2025-12-31 | 2024-12-31 | 2023-12-31 | 2022-12-31 | 2021-12-31 |
|---|---|---|---|---|---|
| Type | yearly | yearly | yearly | yearly | yearly |
| Date | 2025-12-31 | 2024-12-31 | 2023-12-31 | 2022-12-31 | 2021-12-31 |
| Total assets | 488.62M | 396.02M | 37.86M | 43.09M | 54.92M |
| Other current assets | 6.81M | 1.22M | 0.16M | 0.25M | 1.06M |
| Total liab | 16.69M | 13.80M | 0.84M | 1.41M | 3.88M |
| Total stockholder equity | 471.93M | 382.22M | 37.02M | 41.67M | 51.04M |
| Other current liab | 10.60M | 9.37M | 0.56M | 0.69M | 2.28M |
| Common stock | 0.05M | 0.04M | 0.01M | 0.01M | 0.01M |
| Capital stock | 0.05M | 2.97M | - | - | - |
| Retained earnings | -189.16M | -83.72M | -188.74M | -183.40M | -173.48M |
| Cash | 46.94M | 61.58M | 37.43M | 42.45M | 53.36M |
| Total current liabilities | 15.37M | 13.04M | 0.64M | 1.13M | 3.50M |
| Net debt | -45.00M | -60.61M | -37.15M | -42.06M | -52.88M |
| Short term debt | 0.62M | 0.21M | 0.08M | 0.10M | 0.10M |
| Short long term debt total | 1.93M | 0.97M | 0.28M | 0.38M | 0.48M |
| Other stockholder equity | 657.56M | 463.02M | 225.75M | 225.06M | 224.50M |
| Total current assets | 343.86M | 376.87M | 37.59M | 42.70M | 54.42M |
| Long term investments | 142.54M | 18.07M | - | - | - |
| Short term investments | 290.11M | 314.07M | - | - | - |
| Accounts payable | 4.16M | 3.46M | - | 0.33M | 1.12M |
| Accumulated other comprehensive income | 0.55M | -0.04M | - | - | - |
| Non currrent assets other | 0.10M | 0.04M | 0.01M | 0.02M | 0.02M |
| Non current assets total | 144.76M | 19.15M | 0.27M | 0.39M | 0.50M |
| Capital lease obligations | 1.93M | 0.97M | - | - | - |
| Breakdown | 2025-12-31 | 2024-12-31 | 2022-12-31 | 2021-12-31 | 2020-12-31 |
|---|---|---|---|---|---|
| Type | yearly | yearly | yearly | yearly | yearly |
| Date | 2025-12-31 | 2024-12-31 | 2022-12-31 | 2021-12-31 | 2020-12-31 |
| Investments | -96.54M | - | - | - | - |
| Total cashflows from investing activities | -96.75M | -330.13M | -0.00M | -0.04M | -0.02M |
| Net borrowings | 0.00M | - | - | - | - |
| Total cash from financing activities | 170.31M | 449.54M | - | 23.09M | 48.45M |
| Net income | -105.43M | -83.72M | -9.93M | -19.32M | -9.74M |
| Change in cash | -14.64M | 24.14M | -10.91M | 4.29M | 40.71M |
| Begin period cash flow | 61.58M | 37.43M | 53.36M | 49.07M | 8.36M |
| End period cash flow | 46.94M | 61.58M | 42.45M | 53.36M | 49.07M |
| Total cash from operating activities | -88.21M | -57.84M | -10.91M | -18.76M | -7.72M |
| Issuance of capital stock | 0.67M | - | - | - | - |
| Depreciation | 0.08M | 0.03M | 0.11M | 0.09M | 0.09M |
| Capital expenditures | 0.21M | 0.19M | 0.00M | 0.04M | 0.02M |
| Change in working capital | -2.56M | 11.59M | -1.66M | -0.03M | 1.88M |
| Stock based compensation | 24.24M | - | - | - | - |
| Other non cash items | 19.70M | 14.27M | 0.56M | 0.50M | 0.04M |
| Free cash flow | -88.42M | -58.03M | -10.91M | -18.80M | -7.74M |
Sector: Healthcare Industry: Biotechnology
|
Stock Name
|
Change
(USD) |
Price
(USD) |
Trailing
PE (x) |
Forward
PE (x) |
Price Sales
TTM (x) |
Price to Book Value (x)
|
|---|---|---|---|---|---|---|
| ORKA Oruka Therapeutics, Inc. |
- -% |
99.55 | - | - | - | 5.72 |
| NVO Novo Nordisk A/S |
-0.24 0.61% |
40.20 | 41.58 | 31.15 | 2.13 | 32.99 |
| VRTX Vertex Pharmaceuticals Inc |
-21.28 3.85% |
531.87 | 30.22 | 24.27 | 10.36 | 6.50 |
| REGN Regeneron Pharmaceuticals Inc |
12.10 1.26% |
973.36 | 29.07 | 20.12 | 7.57 | 3.82 |
| ARGNF argenx SE |
- -% |
900.30 | 45.77 | 31.25 | 13.84 | 7.12 |
Oruka Therapeutics, Inc., a clinical-stage biopharmaceutical company, focuses on developing novel monoclonal antibody therapeutics for psoriasis (PsO), and other inflammatory and immunology (I&I) indications. Its lead products include ORKA-001 that targets p19 subunit of interleukin-23, which is in phase 2a trial for the treatment of PsO; and ORKA-002 that targets interleukin-17A and interleukin-17F, which is in phase 2 trial for the treatment of PsO, psoriatic arthritis, and other conditions. The company also develops ORKA-003 for targeting an undisclosed pathway; and ORKA-021, a sequential combination regimen of ORKA-002 and ORKA-001. Oruka Therapeutics, Inc. is headquartered in Menlo Park, California.
| Name | Title | Year Born |
|---|---|---|
| Dr. Lawrence Otto Klein Ph.D. | President, CEO & Director | 1983 |
| Mr. Paul T. Quinlan | General Counsel & Secretary | 1963 |
| Dr. Joana Goncalves M.D. | Chief Medical Officer | 1974 |
| Mr. Arjun Agarwal CPA | Senior VP of Finance & Treasurer | 1976 |
| Ms. Laura Sandler | Chief Operating Officer | 1977 |
| Mr. Alan Lada | VP of IR & Capital Markets | NA |
| Mr. Christopher Finch | Senior VP and Head of Business Development & Strategy | NA |
| Dr. Rajiv Panwar | Senior VP and Head of Chemistry, Manufacturing & Controls | NA |
| Mr. Larry Todd Edwards | Chief Commercial Officer | 1963 |
Disclaimer - (*)This information, including any data, is sourced from Unicorn Data Services SAS, trading as EOD Historical Data (“EODHD”) on an ‘as is’ basis, using their API. We cannot guarantee the completeness or validity of the information and data provided on this page, as well as via the API. In some cases, the data may include analyst ratings or recommendations sourced through the EODHD API, which are intended solely for general information purposes.
This information does not consider your personal objectives, financial situation, or needs. Kalkine is not liable for any errors or omissions in the information provided or for any actions taken in reliance on it. You should seek advice from a financial adviser, stockbroker or other professional adviser (including taxation and legal advice) as necessary before acting on this information.

Download a free report with stock ideas and industry insights for general information.
Download Free Report Now →


Basic Materials
 -0.39%
Communication Services
 +0.40%

Consumer Cyclical
-0.20%

Consumer Defensive
-0.56%

Energy
-0.45%

Financial Services
-0.09%
Financials
+0.11%

Healthcare
+0.40%

Industrials
+0.34%

Real Estate
-0.14%

Technology
+0.88%

Utilities
+0.11%
Note: Daily price change (%) by sector excluding stocks with +/-90% daily price change. Companies above $500 million market capitalization are considered.
 Portfolio
 Watchlist


 Please wait processing your request...