 CA
 NZ
 UK
 AU
 IND

 US


…
Safety Shot, Inc., a wellness and functional beverage company, researches and develops over-the-counter products and intellectual property. The company offers Safety Shot Beverage, an over-the-counter drink that lowers blood alcohol content. It also develops Photocil to address psoriasis and vitiligo; JW-700 to treat hair loss; JW-500 for women's sexual wellness; and NoStingz, a jellyfish sting prevention sunscreen. The company sells its products through distributors, retailers, and e-commerce websites. The company was formerly known as Jupiter Wellness, Inc. and changed its name to Safety Shot, Inc. in September 2023. Safety Shot, Inc. was incorporated in 2018 and is based in Jupiter, Florida.
Source: TradingView
The charts and visual representations are sourced from TradingView through embedded widgets. For any issues with chart display, please visit the TradingView website
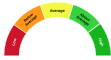
A unique technical analysis driven score developed by Kalkine showing momentum in stock prices based on select technical indicators identified.


| Breakdown | 2023-12-31 | 2022-12-31 | 2021-12-31 | 2020-12-31 | 2019-12-31 |
|---|---|---|---|---|---|
| Type | yearly | yearly | yearly | yearly | yearly |
| Date | 2023-12-31 | 2022-12-31 | 2021-12-31 | 2020-12-31 | 2019-12-31 |
| Income before tax | -14.82M | -15.22M | -28.10M | -6.29M | -0.93M |
| Net income | -15.08M | -15.22M | -28.10M | -6.29M | -0.93M |
| Selling general administrative | 11.24M | 12.52M | 17.31M | 5.58M | 0.91M |
| Selling and marketing expenses | 0.57M | 0.08M | 0.52M | 0.08M | 0.07M |
| Gross profit | -0.29M | 1.03M | 0.54M | 0.44M | -0.01M |
| Reconciled depreciation | 0.62M | 0.52M | 0.19M | 0.16M | 0.00M |
| Ebit | -12.60M | -11.49M | -16.76M | -5.13M | -0.92M |
| Ebitda | -12.38M | -10.97M | -16.58M | -4.97M | -0.92M |
| Depreciation and amortization | 0.22M | 0.52M | 0.19M | 0.16M | 0.00M |
| Operating income | -12.60M | -11.49M | -16.77M | -5.14M | -0.92M |
| Other operating expenses | 12.80M | 17.69M | 19.65M | 6.20M | 0.93M |
| Interest expense | 0.17M | 1.29M | 1.74M | 0.12M | 0.01M |
| Interest income | 0.06M | 0.00M | 0.01M | 0.00M | 0.00M |
| Net interest income | -0.33M | -1.28M | -1.73M | -0.11M | -0.01M |
| Income tax expense | 0.26M | 1.29M | 1.74M | 0.12M | - |
| Total revenue | 0.20M | 6.20M | 2.88M | 1.07M | 0.01M |
| Total operating expenses | 12.31M | 12.52M | 17.31M | 5.58M | 0.91M |
| Cost of revenue | 0.49M | 5.17M | 2.34M | 0.62M | 0.02M |
| Total other income expense net | -2.22M | -2.45M | -9.60M | -1.04M | -0.01M |
| Net income from continuing ops | -17.50M | -15.22M | -28.10M | -6.29M | -0.93M |
| Net income applicable to common shares | - | - | -28.10M | -6.29M | -0.93M |
| Breakdown | 2023-12-31 | 2022-12-31 | 2021-12-31 | 2020-12-31 | 2019-12-31 |
|---|---|---|---|---|---|
| Type | yearly | yearly | yearly | yearly | yearly |
| Date | 2023-12-31 | 2022-12-31 | 2021-12-31 | 2020-12-31 | 2019-12-31 |
| Total assets | 12.71M | 8.69M | 18.87M | 6.53M | 0.75M |
| Intangible assets | 4.51M | 0.29M | 0.74M | 0.56M | - |
| Other current assets | 2.21M | 0.81M | 0.62M | 0.15M | 0.05M |
| Total liab | 3.89M | 5.03M | 2.27M | 2.13M | 0.37M |
| Total stockholder equity | 8.82M | 3.67M | 16.60M | 4.39M | 0.38M |
| Other current liab | 0.33M | 0.37M | 0.16M | 0.11M | 0.01M |
| Common stock | 0.05M | 0.02M | 0.02M | 0.01M | 0.01M |
| Capital stock | - | 0.02M | 0.02M | 0.01M | 0.01M |
| Retained earnings | -65.68M | -50.60M | -35.37M | -7.27M | -0.99M |
| Good will | - | 0.94M | 0.94M | 0.94M | - |
| Cash | 3.83M | 1.93M | 11.75M | 4.26M | 0.53M |
| Total current liabilities | 3.59M | 4.51M | 1.57M | 2.13M | 0.34M |
| Current deferred revenue | - | - | -0.17M | - | - |
| Net debt | -1.76M | 0.80M | -10.89M | -2.93M | -0.18M |
| Short term debt | 1.76M | 2.21M | 0.17M | 1.32M | 0.32M |
| Short long term debt | - | 2.05M | 0.05M | 1.30M | 0.30M |
| Short long term debt total | 2.07M | 2.73M | 0.86M | 1.33M | 0.35M |
| Other stockholder equity | 73.73M | 54.24M | 51.95M | 11.66M | 2.34M |
| Property plant equipment | - | - | 0.91M | 0.06M | - |
| Total current assets | 7.69M | 6.75M | 16.28M | 4.99M | 0.75M |
| Net tangible assets | - | - | 14.92M | 2.89M | 0.38M |
| Short term investments | 0.84M | 2.92M | 2.91M | - | - |
| Net receivables | 0.01M | 0.65M | 0.70M | 0.26M | 0.00M |
| Inventory | 0.80M | 0.44M | 0.30M | 0.23M | 0.14M |
| Accounts payable | 1.49M | 1.93M | 1.24M | 0.69M | 0.01M |
| Accumulated other comprehensive income | 0.73M | - | - | - | -0.99M |
| Non currrent assets other | 4.51M | - | - | - | - |
| Non current assets total | 5.02M | 1.94M | 2.59M | 1.54M | 0.00M |
| Capital lease obligations | - | 0.68M | 0.81M | 0.03M | 0.05M |
| Breakdown | 2023-12-31 | 2022-12-31 | 2021-12-31 | 2020-12-31 | 2019-12-31 |
|---|---|---|---|---|---|
| Type | yearly | yearly | yearly | yearly | yearly |
| Date | 2023-12-31 | 2022-12-31 | 2021-12-31 | 2020-12-31 | 2019-12-31 |
| Investments | 1.36M | -2.47M | -13.15M | -0.25M | 0.00M |
| Change to liabilities | - | - | 0.55M | 0.00M | 0.00M |
| Total cashflows from investing activities | - | - | -13.15M | -0.25M | -0.25M |
| Net borrowings | - | - | -0.18M | 0.36M | 0.30M |
| Total cash from financing activities | 12.80M | -0.96M | 28.21M | 6.71M | 1.06M |
| Change to operating activities | - | - | -0.33M | 0.01M | 0.01M |
| Net income | -14.82M | -15.22M | -28.10M | -6.29M | -0.93M |
| Change in cash | 2.36M | -9.82M | 7.49M | 3.73M | 0.37M |
| Begin period cash flow | 1.48M | 11.75M | 4.26M | 0.53M | 0.16M |
| End period cash flow | 3.83M | 1.93M | 11.75M | 4.26M | 0.53M |
| Total cash from operating activities | -10.11M | -6.40M | -7.57M | -2.73M | -0.69M |
| Issuance of capital stock | 6.79M | 3.45M | 28.32M | 5.86M | 0.76M |
| Depreciation | 0.22M | 0.52M | 0.19M | 0.16M | 0.11M |
| Other cashflows from investing activities | - | - | -2.91M | -2.91M | -2.91M |
| Change to inventory | -0.61M | -0.14M | -0.08M | 0.04M | -0.14M |
| Change to account receivables | 0.37M | 0.05M | -0.40M | -0.10M | -0.00M |
| Sale purchase of stock | 0.00M | -2.88M | 0.00M | - | - |
| Other cashflows from financing activities | 12.76M | 2.12M | 3.04M | 1.65M | 0.33M |
| Change to netincome | - | - | 18.99M | 3.44M | 0.36M |
| Capital expenditures | 2.31M | 0.01M | 0.24M | 0.04M | 0.04M |
| Change in working capital | -1.49M | 0.57M | -0.25M | -0.04M | -0.13M |
| Stock based compensation | 2.08M | 3.24M | 9.39M | 2.40M | 0.36M |
| Other non cash items | 6.91M | 1.10M | 1.60M | 1.04M | 0.46M |
| Free cash flow | -12.42M | -6.41M | -7.81M | -2.78M | -0.69M |
Sector: Consumer Defensive Industry: Beverages - Non-Alcoholic
|
Stock Name
|
Change
(USD) |
Price
(USD) |
Trailing
PE (x) |
Forward
PE (x) |
Price Sales
TTM (x) |
Price to Book Value (x)
|
Enterprise Value
to Revenue (x) |
Enterprise Value
to EBITDA (x) |
|---|---|---|---|---|---|---|---|---|
| SHOT RMG ML Sports Holdings Class A Ordinary Shares |
0.01 0.10% |
9.90 | - | - | 23.11 | 16.83 | 10.76 | -6.55 |
| KO The Coca-Cola Company |
0.90 0.94% |
96.99 | 23.61 | 20.58 | 5.53 | 9.46 | 6.08 | 17.61 |
| PEP PepsiCo Inc |
-0.11 0.08% |
140.54 | 26.80 | 20.62 | 2.53 | 12.49 | 2.90 | 16.87 |
| MNST Monster Beverage Corp |
-0.25 0.57% |
43.69 | 41.32 | 33.90 | 9.48 | 9.25 | 9.21 | 30.01 |
| NNFSF Nongfu Spring Co. Ltd |
- -% |
5.83 | 24.81 | 20.04 | 1.03 | 9.96 | 7.00 | 15.10 |
Safety Shot, Inc., a wellness and functional beverage company, researches and develops over-the-counter products and intellectual property. The company offers Safety Shot Beverage, an over-the-counter drink that lowers blood alcohol content. It also develops Photocil to address psoriasis and vitiligo; JW-700 to treat hair loss; JW-500 for women's sexual wellness; and NoStingz, a jellyfish sting prevention sunscreen. The company sells its products through distributors, retailers, and e-commerce websites. The company was formerly known as Jupiter Wellness, Inc. and changed its name to Safety Shot, Inc. in September 2023. Safety Shot, Inc. was incorporated in 2018 and is based in Jupiter, Florida.

1061 East Indiantown Road, Jupiter, FL, United States, 33477

561 244 7100

8
| Name | Title | Year Born |
|---|---|---|
| Mr. Brian Scott John | Advisor | 1969 |
| Mr. Jarrett A. Boon | CEO & Director | 1967 |
| Mr. Jordan Schur | President & Director | 1964 |
| Ms. Danielle De Rosa-Diaz | Chief Financial Officer | 1977 |
| Mr. David Sandler CSCS, FISSN, FNSCA, HFD, HFS, M.S., MS, RSCC | Chief Operating Officer | 1971 |
| Mr. Anthony Pedicelli | Director of Marketing | NA |
| Dr. Andy Goren M.D. | Chief Medical Officer & Member of Scientific Advisory Board | 1972 |
| Mr. Josh Wagner | Chief Revenue Officer | NA |
Disclaimer - (*)This information, including any data, is sourced from Unicorn Data Services SAS, trading as EOD Historical Data (“EODHD”) on an ‘as is’ basis, using their API. We cannot guarantee the completeness or validity of the information and data provided on this page, as well as via the API. In some cases, the data may include analyst ratings or recommendations sourced through the EODHD API, which are intended solely for general information purposes.
This information does not consider your personal objectives, financial situation, or needs. Kalkine is not liable for any errors or omissions in the information provided or for any actions taken in reliance on it. You should seek advice from a financial adviser, stockbroker or other professional adviser (including taxation and legal advice) as necessary before acting on this information.

Download a free report with stock ideas and industry insights for general information.
Download Free Report Now →


Basic Materials
 -2.93%
Communication Services
-1.00%

Consumer Cyclical
-1.11%

Consumer Defensive
-0.41%

Energy
-1.31%

Financial Services
-1.34%
Financials
-3.22%

Healthcare
-1.31%

Industrials
-1.82%

Real Estate
-0.47%

Technology
-3.76%

Utilities
-0.71%
Note: Daily price change (%) by sector excluding stocks with +/-90% daily price change. Companies above $500 million market capitalization are considered.
 Portfolio
 Watchlist


 +-%
 Please wait processing your request...