 CA
 NZ
 UK
 AU
 IND

 US


…
Sensus Healthcare, Inc. operates as a medical device company that manufactures and sells radiation therapy devices to healthcare providers worldwide. The company uses superficial radiation therapy, a low-energy X-ray technology in its portfolio of treatment devices. It offers SRT-100, a photon X-ray low energy superficial radiotherapy system that provides patients an alternative to surgery for treating non-melanoma skin cancers, including basal cell and squamous cell skin cancers, as well as other skin conditions, such as keloids; and SRT-100 Vision, which provides the user with a superficial radiation therapy-tailored treatment planning application that integrates an embedded high frequency ultrasound imaging module, volumetric tumor analysis, beam margins planning, and dosimetry parameters. The company also provides SRT-100 +; Sentinel service program, which offers its customers protection for their systems; and Transdermal Infusion system, a biophysical alternative to infuse high weight molecule modalities into the dermis for medical and aesthetic purposes without the use of needles. In addition, it sells disposable lead shielding replacements; and disposable radiation safety items, such as aprons and eye shields, ultrasound probe film, and disposable applicator tips to treat various sized lesions and various areas of the body. Further, the company distributes laser devices, such as applications for hair removal, vascular lesions, acne treatment, skin toning, and skin rejuvenation, as well as epidermal pigment removal for spots, freckles, and tattoos, as well as provide operational healthcare services for dermatology clinics. It markets its products primarily to private dermatology practices, and radiation oncologists in both private and hospital settings. The company was incorporated in 2010 and is based in Boca Raton, Florida.
Source: TradingView
The charts and visual representations are sourced from TradingView through embedded widgets. For any issues with chart display, please visit the TradingView website
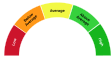
A unique technical analysis driven score developed by Kalkine showing momentum in stock prices based on select technical indicators identified.


| Breakdown | 2025-12-31 | 2024-12-31 | 2023-12-31 | 2022-12-31 | 2021-12-31 |
|---|---|---|---|---|---|
| Type | yearly | yearly | yearly | yearly | yearly |
| Date | 2025-12-31 | 2024-12-31 | 2023-12-31 | 2022-12-31 | 2021-12-31 |
| Income before tax | -9.62M | 9.02M | 0.65M | 27.99M | 4.12M |
| Net income | -7.72M | 6.65M | 0.48M | 24.24M | 4.12M |
| Selling general administrative | 7.87M | 7.15M | 5.16M | 5.01M | 4.59M |
| Selling and marketing expenses | 6.52M | 4.98M | 5.61M | 6.33M | 4.84M |
| Gross profit | 11.87M | 24.43M | 14.06M | 29.63M | 16.99M |
| Reconciled depreciation | 0.63M | 0.43M | 0.28M | 0.32M | 0.61M |
| Ebit | -9.62M | 9.02M | 0.65M | 14.83M | 3.51M |
| Ebitda | -9.24M | 9.45M | 1.11M | 15.21M | 4.12M |
| Depreciation and amortization | 0.39M | 0.43M | 0.46M | 0.38M | 0.61M |
| Non operating income net other | - | - | - | 13.16M | 0.00M |
| Operating income | -10.31M | 8.09M | -0.38M | 14.83M | 4.12M |
| Other operating expenses | 37.79M | 33.72M | 24.79M | 29.70M | 22.92M |
| Interest expense | - | - | 0.00M | 0.00M | 0.00M |
| Tax provision | -1.91M | 2.38M | 0.15M | 3.75M | - |
| Interest income | 0.68M | 0.93M | 1.00M | 0.38M | 0.00M |
| Net interest income | 0.68M | 0.93M | 1.00M | 0.38M | -0.00M |
| Income tax expense | -1.91M | 2.38M | 0.17M | 3.75M | -0.61M |
| Total revenue | 27.48M | 41.81M | 24.41M | 44.53M | 27.04M |
| Total operating expenses | 22.17M | 16.34M | 14.44M | 14.80M | 12.87M |
| Cost of revenue | 15.62M | 17.38M | 10.35M | 14.90M | 10.05M |
| Total other income expense net | 0.68M | 0.93M | 1.03M | 13.16M | -0.00M |
| Net income from continuing ops | -7.72M | 6.65M | -0.90M | 24.24M | 4.12M |
| Net income applicable to common shares | - | - | - | 24.24M | 4.12M |
| Breakdown | 2025-12-31 | 2024-12-31 | 2023-12-31 | 2022-12-31 | 2021-12-31 |
|---|---|---|---|---|---|
| Type | yearly | yearly | yearly | yearly | yearly |
| Date | 2025-12-31 | 2024-12-31 | 2023-12-31 | 2022-12-31 | 2021-12-31 |
| Total assets | 53.04M | 62.16M | 53.73M | 56.73M | 32.24M |
| Intangible assets | - | - | - | 0.05M | 0.15M |
| Other current assets | 3.21M | 4.85M | 0.89M | 7.39M | 2.84M |
| Total liab | 4.94M | 6.34M | 4.88M | 8.67M | 6.22M |
| Total stockholder equity | 48.10M | 55.83M | 48.84M | 48.07M | 26.02M |
| Deferred long term liab | - | - | - | 0.14M | 0.26M |
| Other current liab | 0.28M | 0.33M | 0.57M | 1.29M | 0.51M |
| Common stock | 0.17M | 0.17M | 0.17M | 0.17M | 0.17M |
| Capital stock | 0.17M | 0.17M | 0.17M | 0.17M | 0.17M |
| Retained earnings | 5.71M | 13.43M | 6.79M | 6.30M | -17.94M |
| Other liab | - | - | - | 0.14M | 0.26M |
| Other assets | - | - | 0.00M | - | 0.07M |
| Cash | 22.08M | 22.06M | 23.15M | 25.52M | 14.52M |
| Total current liabilities | 4.72M | 5.88M | 4.21M | 7.70M | 5.96M |
| Current deferred revenue | 0.84M | 0.54M | 0.66M | 0.69M | 1.17M |
| Net debt | -21.40M | -21.45M | -22.36M | -24.50M | -14.29M |
| Short term debt | 0.26M | 0.20M | 0.19M | 0.19M | 0.23M |
| Short long term debt | - | - | - | - | 0.05M |
| Short long term debt total | 0.68M | 0.60M | 0.78M | 1.02M | 0.23M |
| Other stockholder equity | 42.21M | 42.22M | 41.89M | 41.60M | 43.79M |
| Property plant equipment | - | - | - | 0.24M | 0.77M |
| Total current assets | 45.89M | 56.74M | 49.53M | 53.71M | 31.25M |
| Net tangible assets | - | - | - | 48.02M | 25.87M |
| Net receivables | 6.04M | 19.73M | 10.64M | 17.30M | 12.13M |
| Inventory | 14.56M | 10.10M | 14.85M | 3.50M | 1.76M |
| Accounts payable | 3.34M | 4.81M | 2.79M | 5.52M | 4.06M |
| Accumulated other comprehensive income | - | - | 0.00M | - | - |
| Common stock total equity | - | - | - | 0.17M | 0.17M |
| Retained earnings total equity | - | - | - | 6.30M | -17.94M |
| Treasury stock | - | - | - | -3.43M | -0.33M |
| Non currrent assets other | 0.64M | 0.65M | 0.80M | 0.02M | 0.07M |
| Non current assets total | 7.15M | 5.43M | 4.20M | 3.03M | 0.99M |
| Capital lease obligations | 0.47M | 0.60M | 0.78M | 1.02M | 0.17M |
| Breakdown | 2025-12-31 | 2024-12-31 | 2023-12-31 | 2022-12-31 | 2021-12-31 |
|---|---|---|---|---|---|
| Type | yearly | yearly | yearly | yearly | yearly |
| Date | 2025-12-31 | 2024-12-31 | 2023-12-31 | 2022-12-31 | 2021-12-31 |
| Investments | - | -0.28M | -0.20M | 14.84M | 0.13M |
| Change to liabilities | - | - | - | 0.00M | 0.33M |
| Total cashflows from investing activities | -0.20M | -0.28M | -0.19M | 14.84M | 0.13M |
| Net borrowings | - | - | 0.00M | - | -0.22M |
| Total cash from financing activities | -0.30M | 0.01M | -0.04M | -2.43M | -0.23M |
| Change to operating activities | - | - | - | - | -0.77M |
| Net income | -7.72M | 6.65M | 0.48M | 24.24M | 4.12M |
| Change in cash | 0.03M | -1.09M | -2.37M | 11.00M | -0.39M |
| Begin period cash flow | 22.06M | 23.15M | 25.52M | 14.52M | 14.91M |
| End period cash flow | 22.08M | 22.06M | 23.15M | 25.52M | 14.52M |
| Total cash from operating activities | 0.53M | -0.83M | -2.15M | -1.41M | -0.29M |
| Depreciation | 0.63M | 0.43M | 0.46M | 0.32M | 0.61M |
| Other cashflows from investing activities | -0.20M | - | 0.04M | 15.00M | 0.26M |
| Change to inventory | -4.63M | 0.27M | -8.58M | -3.19M | 2.73M |
| Change to account receivables | 13.65M | -9.21M | 6.65M | -5.31M | -8.43M |
| Sale purchase of stock | -0.30M | -0.05M | -0.03M | -3.00M | - |
| Other cashflows from financing activities | -0.01M | -0.05M | -0.01M | 0.62M | -0.01M |
| Change to netincome | - | - | - | -25.66M | -4.41M |
| Capital expenditures | 0.20M | 0.28M | 0.23M | 0.16M | 0.13M |
| Cash and cash equivalents changes | - | - | - | 11.00M | -0.39M |
| Change in working capital | 8.66M | -8.55M | -3.56M | -12.73M | -6.14M |
| Stock based compensation | 0.29M | 0.32M | 0.33M | 0.19M | 0.41M |
| Other non cash items | 0.55M | 0.38M | 0.57M | -11.71M | -0.04M |
| Free cash flow | 0.33M | -1.11M | -2.37M | -1.57M | -0.41M |
Sector: Healthcare Industry: Medical Devices
|
Stock Name
|
Change
(USD) |
Price
(USD) |
Trailing
PE (x) |
Forward
PE (x) |
Price Sales
TTM (x) |
Price to Book Value (x)
|
Enterprise Value
to Revenue (x) |
Enterprise Value
to EBITDA (x) |
|---|---|---|---|---|---|---|---|---|
| SRTS Sensus Healthcare Inc |
-0.03 0.88% |
3.38 | - | 21.37 | 2.90 | 1.36 | 2.02 | 8.68 |
| ABT Abbott Laboratories |
-0.71 0.65% |
108.58 | 25.97 | 17.24 | 3.57 | 3.20 | 3.81 | 16.75 |
| MDT Medtronic PLC |
0.28 0.28% |
101.89 | 26.60 | 15.87 | 3.35 | 2.08 | 3.90 | 14.12 |
| SYK Stryker Corporation |
-2.16 0.68% |
316.63 | 29.23 | 16.86 | 4.18 | 4.51 | 4.63 | 17.16 |
| SEMHF Siemens Healthineers AG |
- -% |
47.31 | 39.57 | 21.32 | 3.01 | 3.29 | 2.95 | 16.92 |
Sensus Healthcare, Inc. operates as a medical device company that manufactures and sells radiation therapy devices to healthcare providers worldwide. The company uses superficial radiation therapy, a low-energy X-ray technology in its portfolio of treatment devices. It offers SRT-100, a photon X-ray low energy superficial radiotherapy system that provides patients an alternative to surgery for treating non-melanoma skin cancers, including basal cell and squamous cell skin cancers, as well as other skin conditions, such as keloids; and SRT-100 Vision, which provides the user with a superficial radiation therapy-tailored treatment planning application that integrates an embedded high frequency ultrasound imaging module, volumetric tumor analysis, beam margins planning, and dosimetry parameters. The company also provides SRT-100 +; Sentinel service program, which offers its customers protection for their systems; and Transdermal Infusion system, a biophysical alternative to infuse high weight molecule modalities into the dermis for medical and aesthetic purposes without the use of needles. In addition, it sells disposable lead shielding replacements; and disposable radiation safety items, such as aprons and eye shields, ultrasound probe film, and disposable applicator tips to treat various sized lesions and various areas of the body. Further, the company distributes laser devices, such as applications for hair removal, vascular lesions, acne treatment, skin toning, and skin rejuvenation, as well as epidermal pigment removal for spots, freckles, and tattoos, as well as provide operational healthcare services for dermatology clinics. It markets its products primarily to private dermatology practices, and radiation oncologists in both private and hospital settings. The company was incorporated in 2010 and is based in Boca Raton, Florida.

851 Broken Sound Parkway NW, Boca Raton, FL, United States, 33487

561 922 5808

60
| Name | Title | Year Born |
|---|---|---|
| Mr. Joseph C. Sardano | Co-Founder, Chairman & CEO | 1953 |
| Mr. Michael J. Sardano | Pres & Gen. Counsel | 1989 |
| Mr. Javier Rampolla | Chief Financial Officer | 1973 |
| Mr. Nicolas Soro | Chief Operating Officer | 1985 |
| Mr. Benson Suen | VP of International Sales | NA |
| Dr. Mark S. Nestor | Medical Director & Member of Medical Advisory Board | NA |
| Dr. Clay Jefferies Cockerell | Clinical Director & Member of Medical Advisory Board | 1957 |
| Mr. Michael J. Sardano | President, General Counsel, Corporate Secretary & Director | 1989 |
| Ms. Magdalena Martinez | Chief Operating Officer | 1990 |
| Mr. Emiliano Sosa | Chief Technology Officer | 1978 |
Disclaimer - (*)This information, including any data, is sourced from Unicorn Data Services SAS, trading as EOD Historical Data (“EODHD”) on an ‘as is’ basis, using their API. We cannot guarantee the completeness or validity of the information and data provided on this page, as well as via the API. In some cases, the data may include analyst ratings or recommendations sourced through the EODHD API, which are intended solely for general information purposes.
This information does not consider your personal objectives, financial situation, or needs. Kalkine is not liable for any errors or omissions in the information provided or for any actions taken in reliance on it. You should seek advice from a financial adviser, stockbroker or other professional adviser (including taxation and legal advice) as necessary before acting on this information.

Download a free report with stock ideas and industry insights for general information.
Download Free Report Now →


Basic Materials
 -1.40%
Communication Services
-0.45%

Consumer Cyclical
-0.55%

Consumer Defensive
-0.01%

Energy
-0.01%

Financial Services
-0.40%
Financials
-0.15%

Healthcare
-1.15%

Industrials
-0.46%

Real Estate
-0.29%

Technology
-1.22%

Utilities
-0.10%
Note: Daily price change (%) by sector excluding stocks with +/-90% daily price change. Companies above $500 million market capitalization are considered.
 Portfolio
 Watchlist


 +0.55%
 Please wait processing your request...