 CA
 NZ
 UK
 AU
 IND

 US


…
Celanese Corporation produces and sells engineered polymers worldwide. It operates through Engineered Materials and Acetyl Chain segments. The company offers ethylene acrylic elastomers, ethylene vinyl acetate pharmaceutical grade copolymers, liquid crystal polymers, long-fiber reinforced thermoplastics, nylon and polypropylene compounds and formulations, polyoxymethylene, ultra-high molecular weight polyethylene, and thermoplastic elastomers, polyesters, and vulcanizates for use in appliance, automotive, construction, consumer apparel, consumer electronics, electrical, energy storage, filtration equipment, industrial, medical, and telecommunication applications. It also provides acetic acid and anhydride, acetate flakes and tows, butyl acetates, emulsion polymers, ethyl acetates, ethylene vinyl acetate resins and compounds, formaldehydes, redispersible powders, and vinyl acetate monomers for use in adhesives, automotive parts, coatings, consumer goods, external thermal insulation composite systems, films, filtration, flexible packaging, food and beverage, food packaging, inks, lamination, lubricants, paints, paper finishing, pharmaceuticals, plasticizers, plasters and renders, solvents, textiles, and tiling applications. The company offers its products under the Amcel, AOPlus, Ateva, Avicor, Celanese, Celanex, Celanyl, Celcon, Celstran, Celvolit, Clarifoil, Crastin, Dur-O-Set, Dytron, ECOMID, EcoVAE, Elotex, Factor, Flexbond, Forprene, FRIANYL, Fortron, Geolast, GHR, GUR, Hostaform, Hytrel, Laprene, Melinex, MetaLX, Mowilith, MT, Mylar, NILAMID, Nylfor, OmniLon, Pibifor, Pibiter, Polifor, Resyn, Rynite, Santoprene, SlideX, Sofprene, Sofpur, Talcoprene, Tarnoform, Tecnoprene, TufCOR, Tynex, Vamac, VAntage, Vectra, Vinac, Vinamul, VitalDose, Zenite, and Zytel brands. It sells its products directly to customers and through distributors; and original equipment manufacturers and suppliers. Celanese Corporation was founded in 1912 and is headquartered in Irving, Texas.
Source: TradingView
The charts and visual representations are sourced from TradingView through embedded widgets. For any issues with chart display, please visit the TradingView website
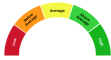
A unique technical analysis driven score developed by Kalkine showing momentum in stock prices based on select technical indicators identified.
Celanese Corporation is a global chemical company that produces engineered materials and acetyl products used across automotive, electronics, medical, packaging and industrial markets. Long-term growth may be supported by demand for higher-performance polymers, lightweighting and electrification trends, geographic expansion and margin improvement in specialty businesses. Investors may find the company attractive for its scale in specialty polymers and integrated acetyl production that appears positioned to generate stable cash flow.
Key risks include exposure to cyclical end-market demand and commodity feedstock and energy price volatility, along with operational, regulatory and integration risks that could pressure margins.

Note: The summary and risk score provided above is created by AI and should not be construed as a recommendation of Kalkine.


| Breakdown | 2025-12-31 | 2024-12-31 | 2023-12-31 | 2022-12-31 | 2021-12-31 |
|---|---|---|---|---|---|
| Type | yearly | yearly | yearly | yearly | yearly |
| Date | 2025-12-31 | 2024-12-31 | 2023-12-31 | 2022-12-31 | 2021-12-31 |
| Income before tax | -1220.00M | -996.00M | 1183.00M | 1421.00M | 2248.00M |
| Minority interest | -14.00M | -8.00M | -3.00M | -8.00M | -6.00M |
| Net income | -1165.00M | -1522.00M | 1960.00M | 1894.00M | 1890.00M |
| Selling general administrative | 899.00M | 1030.00M | 1074.00M | 824.00M | 633.00M |
| Gross profit | 1791.00M | 2356.00M | 2603.00M | 2380.00M | 2682.00M |
| Reconciled depreciation | 786.00M | 823.00M | 704.00M | 62.00M | 25.00M |
| Ebit | -451.00M | -320.00M | 1903.00M | 1378.00M | 1946.00M |
| Ebitda | 292.00M | 503.00M | 2614.00M | 1751.00M | 2212.00M |
| Depreciation and amortization | 743.00M | 823.00M | 711.00M | 373.00M | 266.00M |
| Non operating income net other | - | - | - | 431.00M | 287.00M |
| Operating income | 767.00M | -697.00M | 1687.00M | 1378.00M | 1946.00M |
| Other operating expenses | 8777.00M | 10977.00M | 9253.00M | 8291.00M | 6599.00M |
| Interest expense | 769.00M | 676.00M | 720.00M | 405.00M | 91.00M |
| Tax provision | -90.00M | 510.00M | -1055.00M | -489.00M | 330.00M |
| Interest income | 496.00M | 33.00M | 60.00M | 69.00M | 201.00M |
| Net interest income | -745.00M | -643.00M | -657.00M | -336.00M | -92.00M |
| Extraordinary items | -21.00M | -8.00M | -9.00M | -8.00M | -22.00M |
| Non recurring | - | - | - | 8.00M | -3.00M |
| Income tax expense | -90.00M | 510.00M | -790.00M | -489.00M | 330.00M |
| Total revenue | 9544.00M | 10280.00M | 10940.00M | 9673.00M | 8537.00M |
| Total operating expenses | 1024.00M | 3053.00M | 916.00M | 998.00M | 744.00M |
| Cost of revenue | 7753.00M | 7924.00M | 8337.00M | 7293.00M | 5855.00M |
| Total other income expense net | -1987.00M | -299.00M | -504.00M | 43.00M | 302.00M |
| Discontinued operations | - | - | - | -8.00M | -22.00M |
| Net income from continuing ops | -1130.00M | -1506.00M | 2036.00M | 1910.00M | 1918.00M |
| Net income applicable to common shares | -1165.00M | -1522.00M | 1960.00M | 1894.00M | 1890.00M |
| Breakdown | 2025-12-31 | 2024-12-31 | 2023-12-31 | 2022-12-31 | 2021-12-31 |
|---|---|---|---|---|---|
| Type | yearly | yearly | yearly | yearly | yearly |
| Date | 2025-12-31 | 2024-12-31 | 2023-12-31 | 2022-12-31 | 2021-12-31 |
| Total assets | 21695.00M | 22857.00M | 26597.00M | 26272.00M | 11975.00M |
| Intangible assets | 3184.00M | 3641.00M | 3975.00M | 4105.00M | 735.00M |
| Other current assets | 743.00M | 285.00M | 272.00M | 241.00M | 70.00M |
| Total liab | 17223.00M | 17248.00M | 19045.00M | 20167.00M | 7438.00M |
| Total stockholder equity | 4049.00M | 5609.00M | 7091.00M | 5637.00M | 4189.00M |
| Deferred long term liab | - | - | - | 1242.00M | 555.00M |
| Other current liab | 940.00M | 1120.00M | 937.00M | 436.00M | 473.00M |
| Common stock | 0.17M | 0.02M | 0.02M | 0.02M | 0.02M |
| Capital stock | 0.00M | 0.00M | 0.00M | 0.00M | 0.00M |
| Retained earnings | 9876.00M | 11100.00M | 12929.00M | 11274.00M | 9677.00M |
| Other liab | - | - | - | 2362.00M | 1557.00M |
| Good will | 4171.00M | 5387.00M | 6977.00M | 7142.00M | 1412.00M |
| Other assets | 1960.00M | 1806.00M | 2201.00M | 1355.00M | 769.00M |
| Cash | 1263.00M | 962.00M | 1805.00M | 1508.00M | 536.00M |
| Cash and equivalents | 1263.00M | 962.00M | 1805.00M | 1508.00M | 536.00M |
| Total current liabilities | 3683.00M | 3853.00M | 4072.00M | 4068.00M | 2505.00M |
| Current deferred revenue | - | - | 25.00M | 808.00M | 81.00M |
| Net debt | 11671.00M | 11617.00M | 12293.00M | 13535.00M | 3631.00M |
| Short term debt | 1275.00M | 1501.00M | 1472.00M | 1306.00M | 791.00M |
| Short long term debt | 1204.00M | 1501.00M | 1383.00M | 1306.00M | 791.00M |
| Short long term debt total | 12934.00M | 12952.00M | 14098.00M | 15043.00M | 4167.00M |
| Other stockholder equity | -5051.00M | -5077.00M | -5094.00M | -5119.00M | -5159.00M |
| Property plant equipment | 5435.00M | 5661.00M | 6006.00M | 5584.00M | 4429.00M |
| Total current assets | 5693.00M | 5145.00M | 6218.00M | 6611.00M | 3807.00M |
| Long term investments | 1252.00M | 1217.00M | 1220.00M | 1062.00M | 823.00M |
| Net tangible assets | - | - | - | 6001.00M | 2042.00M |
| Short term investments | - | - | - | - | 10.00M |
| Net receivables | 1467.00M | 1614.00M | 1784.00M | 2054.00M | 1667.00M |
| Long term debt | 11394.00M | 11078.00M | 12301.00M | 13373.00M | 3176.00M |
| Inventory | 2220.00M | 2284.00M | 2357.00M | 2808.00M | 1524.00M |
| Accounts payable | 1279.00M | 1228.00M | 1510.00M | 1518.00M | 1160.00M |
| Noncontrolling interest in consolidated entity | - | - | - | 468.00M | 348.00M |
| Accumulated other comprehensive income | -776.00M | -848.00M | -744.00M | -518.00M | -329.00M |
| Retained earnings total equity | - | - | - | 11274.00M | 9677.00M |
| Treasury stock | - | - | - | -5491.00M | -5492.00M |
| Non currrent assets other | 601.00M | 555.00M | 524.00M | 547.00M | 521.00M |
| Non current assets total | 16002.00M | 17712.00M | 20379.00M | 19661.00M | 8168.00M |
| Capital lease obligations | 336.00M | 373.00M | 414.00M | 364.00M | 200.00M |
| Long term debt total | 11394.00M | 11078.00M | 12301.00M | 13373.00M | 3176.00M |
| Breakdown | 2025-12-31 | 2024-12-31 | 2023-12-31 | 2022-12-31 | 2021-12-31 |
|---|---|---|---|---|---|
| Type | yearly | yearly | yearly | yearly | yearly |
| Date | 2025-12-31 | 2024-12-31 | 2023-12-31 | 2022-12-31 | 2021-12-31 |
| Investments | - | -470.00M | -10679.00M | -11141.00M | 516.00M |
| Change to liabilities | - | - | - | 328.00M | 355.00M |
| Total cashflows from investing activities | -349.00M | -470.00M | -134.00M | -11141.00M | -1119.00M |
| Net borrowings | -323.00M | -948.00M | -1088.00M | 10716.00M | 404.00M |
| Total cash from financing activities | -513.00M | -1313.00M | -1456.00M | 10290.00M | -1042.00M |
| Change to operating activities | - | - | - | 399.00M | -78.00M |
| Net income | -1144.00M | -1514.00M | 1964.00M | 1902.00M | 1896.00M |
| Change in cash | 301.00M | -843.00M | 297.00M | 972.00M | -419.00M |
| Begin period cash flow | 962.00M | 1805.00M | 1508.00M | 536.00M | 955.00M |
| End period cash flow | 1263.00M | 962.00M | 1805.00M | 1508.00M | 536.00M |
| Total cash from operating activities | 1146.00M | 966.00M | 1899.00M | 1819.00M | 1757.00M |
| Depreciation | 777.00M | 823.00M | 711.00M | 478.00M | 378.00M |
| Other cashflows from investing activities | -27.00M | -52.00M | -98.00M | -10598.00M | -1168.00M |
| Dividends paid | 13.00M | 307.00M | 305.00M | -297.00M | -304.00M |
| Change to inventory | 154.00M | 11.00M | 398.00M | -253.00M | -367.00M |
| Change to account receivables | 213.00M | 92.00M | 105.00M | 218.00M | -396.00M |
| Sale purchase of stock | - | 1.00M | 0.00M | -17.00M | -1000.00M |
| Other cashflows from financing activities | -177.00M | -59.00M | -63.00M | 11130.00M | -142.00M |
| Change to netincome | - | - | - | -837.00M | 66.00M |
| Capital expenditures | 343.00M | 435.00M | 568.00M | 543.00M | 467.00M |
| Change receivables | - | - | - | 218.00M | -396.00M |
| Cash flows other operating | - | - | - | -98.00M | -216.00M |
| Cash and cash equivalents changes | - | - | - | 968.00M | -404.00M |
| Change in working capital | 235.00M | -204.00M | 516.00M | 280.00M | -488.00M |
| Stock based compensation | 24.00M | 32.00M | 40.00M | 60.00M | 95.00M |
| Other non cash items | 1556.00M | 1613.00M | -365.00M | -66.00M | -137.00M |
| Free cash flow | 803.00M | 531.00M | 1331.00M | 1276.00M | 1290.00M |
Sector: Basic Materials Industry: Chemicals
|
Stock Name
|
Change
(USD) |
Price
(USD) |
Trailing
PE (x) |
Forward
PE (x) |
Price Sales
TTM (x) |
Price to Book Value (x)
|
Enterprise Value
to Revenue (x) |
Enterprise Value
to EBITDA (x) |
|---|---|---|---|---|---|---|---|---|
| CE Celanese Corporation |
0.22 0.45% |
48.85 | - | 13.18 | 0.77 | 1.82 | 1.99 | 71.28 |
| SHECF Shin-Etsu Chemical Co. Ltd |
-0.12 0.31% |
38.88 | 23.22 | 18.73 | 0.03 | 2.38 | 3.50 | 9.45 |
| SHECY Shin-Etsu Chemical Co Ltd ADR |
-0.19 0.98% |
19.26 | 22.65 | 18.25 | 0.03 | 2.32 | 3.46 | 9.34 |
| BFFAF BASF SE NA O.N. |
- -% |
57.33 | 33.31 | 25.58 | 0.93 | 1.43 | 1.13 | 8.85 |
| BASFY BASF SE ADR |
0.21 1.45% |
14.74 | 33.15 | 25.25 | 0.93 | 1.41 | 1.13 | 8.85 |
Celanese Corporation produces and sells engineered polymers worldwide. It operates through Engineered Materials and Acetyl Chain segments. The company offers ethylene acrylic elastomers, ethylene vinyl acetate pharmaceutical grade copolymers, liquid crystal polymers, long-fiber reinforced thermoplastics, nylon and polypropylene compounds and formulations, polyoxymethylene, ultra-high molecular weight polyethylene, and thermoplastic elastomers, polyesters, and vulcanizates for use in appliance, automotive, construction, consumer apparel, consumer electronics, electrical, energy storage, filtration equipment, industrial, medical, and telecommunication applications. It also provides acetic acid and anhydride, acetate flakes and tows, butyl acetates, emulsion polymers, ethyl acetates, ethylene vinyl acetate resins and compounds, formaldehydes, redispersible powders, and vinyl acetate monomers for use in adhesives, automotive parts, coatings, consumer goods, external thermal insulation composite systems, films, filtration, flexible packaging, food and beverage, food packaging, inks, lamination, lubricants, paints, paper finishing, pharmaceuticals, plasticizers, plasters and renders, solvents, textiles, and tiling applications. The company offers its products under the Amcel, AOPlus, Ateva, Avicor, Celanese, Celanex, Celanyl, Celcon, Celstran, Celvolit, Clarifoil, Crastin, Dur-O-Set, Dytron, ECOMID, EcoVAE, Elotex, Factor, Flexbond, Forprene, FRIANYL, Fortron, Geolast, GHR, GUR, Hostaform, Hytrel, Laprene, Melinex, MetaLX, Mowilith, MT, Mylar, NILAMID, Nylfor, OmniLon, Pibifor, Pibiter, Polifor, Resyn, Rynite, Santoprene, SlideX, Sofprene, Sofpur, Talcoprene, Tarnoform, Tecnoprene, TufCOR, Tynex, Vamac, VAntage, Vectra, Vinac, Vinamul, VitalDose, Zenite, and Zytel brands. It sells its products directly to customers and through distributors; and original equipment manufacturers and suppliers. Celanese Corporation was founded in 1912 and is headquartered in Irving, Texas.

222 W. Las Colinas Blvd., Irving, TX, United States, 75039-5421

972 443 4000

11434
| Name | Title | Year Born |
|---|---|---|
| Ms. Lori J. Ryerkerk BS | Chairman, Pres & CEO | 1963 |
| Mr. Scott A. Richardson | Exec. VP & CFO | 1977 |
| Ms. A. Lynne Puckett | Sr. VP, Gen. Counsel & Corp. Sec. | 1963 |
| Mr. John G. Fotheringham | Sr. VP of Acetyls (Leave of Absence) | 1969 |
| Mr. Thomas Francis Kelly | Sr. VP of Engineered Materials | 1965 |
| Mr. Aaron M. McGilvray | Chief Accounting Officer & VP | 1976 |
| Mr. Sameer Purao | VP & Chief Information Officer | NA |
| Ms. Vanessa A. Dupuis | Sr. VP & Chief HR Officer | 1974 |
| Mr. Jon Mortimer | Sr. VP of Global Manufacturing | NA |
| Ms. Ashley Duffie | VP & Chief Procurement Officer | NA |
Disclaimer - (*)This information, including any data, is sourced from Unicorn Data Services SAS, trading as EOD Historical Data (“EODHD”) on an ‘as is’ basis, using their API. We cannot guarantee the completeness or validity of the information and data provided on this page, as well as via the API. In some cases, the data may include analyst ratings or recommendations sourced through the EODHD API, which are intended solely for general information purposes.
This information does not consider your personal objectives, financial situation, or needs. Kalkine is not liable for any errors or omissions in the information provided or for any actions taken in reliance on it. You should seek advice from a financial adviser, stockbroker or other professional adviser (including taxation and legal advice) as necessary before acting on this information.

Download a free report with stock ideas and industry insights for general information.
Download Free Report Now →


Basic Materials
 +0.02%
Communication Services
 -0.63%

Consumer Cyclical
-0.11%

Consumer Defensive
-0.45%

Energy
+0.39%

Financial Services
-0.10%
Financials
-0.81%

Healthcare
+1.03%

Industrials
+0.32%

Real Estate
-0.31%

Technology
+0.59%

Utilities
-0.18%
Note: Daily price change (%) by sector excluding stocks with +/-90% daily price change. Companies above $500 million market capitalization are considered.
 Portfolio
 Watchlist


 Please wait processing your request...