 CA
 NZ
 UK
 AU
 IND

 US


…
Guardian Pharmacy Services, Inc., a pharmacy service company, provides a suite of technology-enabled services to help residents of long-term health care facilities (LTCFs) in the United States. The company's individualized clinical, drug dispensing, and administration capabilities are used to serve the needs of residents in lower acuity LTCFs, such as assisted living facilities, behavioral health facilities, and group homes. Its Guardian Compass includes dashboards created using data from its data warehouse to help its local pharmacies plan, track, and optimize their business operations; GuardianShield Programs for LTCFs; Order Entry QA Analyzer, which utilizes real-time rules- engine technology to examine prescriptions and detect omissions and/or errors before they become a customer service problem; and Medication Spend Analyzer to break down the monthly drug spending for each of the LTCFs. Guardian Pharmacy Services, Inc. was founded in 2003 and is headquartered in Atlanta, Georgia.
Source: TradingView
The charts and visual representations are sourced from TradingView through embedded widgets. For any issues with chart display, please visit the TradingView website
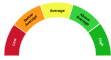
A unique technical analysis driven score developed by Kalkine showing momentum in stock prices based on select technical indicators identified.


| Breakdown | 2025-12-31 | 2024-12-31 | 2023-12-31 | 2022-12-31 | 2021-12-31 |
|---|---|---|---|---|---|
| Type | yearly | yearly | yearly | yearly | yearly |
| Date | 2025-12-31 | 2024-12-31 | 2023-12-31 | 2022-12-31 | 2021-12-31 |
| Income before tax | 73.42M | -66.48M | 37.72M | 49.66M | 28.33M |
| Minority interest | 0.26M | -16.25M | -13.82M | -14.24M | -12.01M |
| Net income | 49.22M | -87.29M | 23.90M | 35.42M | 16.31M |
| Selling general administrative | 220.02M | 299.35M | 167.36M | 3.38M | 13.03M |
| Selling and marketing expenses | - | 3.50M | - | 137.26M | 118.09M |
| Gross profit | 282.04M | 244.37M | 208.31M | 185.87M | 161.26M |
| Reconciled depreciation | 22.34M | 19.77M | 18.23M | 16.56M | 16.53M |
| Ebit | 88.91M | -63.20M | 40.58M | 51.59M | 29.96M |
| Ebitda | 111.25M | -43.43M | 58.81M | 68.15M | 46.49M |
| Depreciation and amortization | 22.34M | 19.77M | 18.23M | 16.56M | 16.53M |
| Operating income | 88.91M | -62.92M | 40.95M | 51.99M | 30.15M |
| Other operating expenses | 1359.77M | 1291.33M | 1005.25M | 856.92M | 761.92M |
| Interest expense | 0.67M | 3.28M | 2.86M | 1.93M | 1.64M |
| Tax provision | 24.46M | 4.56M | 0.00M | - | - |
| Net interest income | -0.67M | -3.28M | -2.86M | -1.93M | -1.64M |
| Income tax expense | 24.46M | 4.56M | - | - | - |
| Total revenue | 1448.68M | 1228.41M | 1046.19M | 908.91M | 792.07M |
| Total operating expenses | 193.13M | 307.29M | 167.36M | 133.88M | 131.12M |
| Cost of revenue | 1166.64M | 984.04M | 837.88M | 723.04M | 630.81M |
| Total other income expense net | -15.49M | -3.56M | -3.23M | -2.33M | -1.82M |
| Net income from continuing ops | 48.96M | -71.03M | 37.72M | 49.66M | 28.33M |
| Breakdown | 2025-12-31 | 2024-12-31 | 2023-12-31 | 2022-12-31 | 2021-12-31 |
|---|---|---|---|---|---|
| Type | yearly | yearly | yearly | yearly | yearly |
| Date | 2025-12-31 | 2024-12-31 | 2023-12-31 | 2022-12-31 | 2021-12-31 |
| Total assets | 412.66M | 320.81M | 271.17M | 256.11M | 235.85M |
| Intangible assets | 18.48M | 14.91M | 11.98M | 14.44M | 17.09M |
| Other current assets | 11.04M | 9.62M | 14.86M | 10.12M | 8.52M |
| Total liab | 194.73M | 170.83M | 211.31M | 180.18M | 182.53M |
| Total stockholder equity | 205.76M | 142.67M | 28.21M | 42.73M | 23.93M |
| Other current liab | 30.20M | 31.08M | 29.29M | 17.56M | 34.99M |
| Common stock | 0.06M | 0.06M | 28.21M | 42.73M | 24.11M |
| Capital stock | 0.06M | 0.06M | - | - | - |
| Retained earnings | 66.34M | 17.12M | - | - | - |
| Good will | 79.74M | 69.30M | 56.05M | 56.05M | 54.63M |
| Cash | 65.62M | 4.66M | 0.75M | 0.61M | 15.01M |
| Total current liabilities | 160.70M | 144.12M | 138.01M | 112.00M | 111.54M |
| Net debt | -20.89M | 32.67M | 68.40M | 62.38M | 40.03M |
| Short term debt | 14.30M | 10.62M | 23.12M | 16.34M | 11.93M |
| Short long term debt | - | - | 12.98M | 7.96M | 3.71M |
| Short long term debt total | 44.72M | 37.33M | 69.15M | 62.98M | 55.04M |
| Other stockholder equity | 139.35M | 125.48M | - | - | -0.00M |
| Total current assets | 221.63M | 151.99M | 129.60M | 120.00M | 111.87M |
| Net receivables | 101.61M | 97.15M | 77.26M | 67.83M | 55.25M |
| Long term debt | - | - | 18.99M | 22.97M | 26.99M |
| Inventory | 43.36M | 40.55M | 36.73M | 41.44M | 33.09M |
| Accounts payable | 116.21M | 102.42M | 85.60M | 78.10M | 64.62M |
| Accumulated other comprehensive income | - | 0.00M | - | - | -0.18M |
| Non currrent assets other | 0.44M | 5.66M | 0.36M | 0.43M | 0.53M |
| Non current assets total | 191.02M | 168.82M | 141.56M | 136.12M | 123.98M |
| Capital lease obligations | 37.14M | 30.13M | 29.03M | 25.88M | 19.73M |
| Breakdown | 2025-12-31 | 2024-12-31 | 2023-12-31 | 2022-12-31 | 2021-12-31 |
|---|---|---|---|---|---|
| Type | yearly | yearly | yearly | yearly | yearly |
| Date | 2025-12-31 | 2024-12-31 | 2023-12-31 | 2022-12-31 | 2021-12-31 |
| Investments | - | -30.41M | -13.44M | -17.90M | -13.15M |
| Total cashflows from investing activities | -32.26M | -30.41M | -13.44M | -17.90M | -13.15M |
| Net borrowings | -4.98M | -36.48M | -2.89M | -2.80M | -6.10M |
| Total cash from financing activities | -7.07M | -23.64M | -57.23M | -45.03M | -36.79M |
| Net income | 49.22M | -71.03M | 37.72M | 49.66M | 28.33M |
| Change in cash | 60.96M | 3.91M | 0.14M | -14.40M | 8.56M |
| Begin period cash flow | 4.66M | 0.75M | 0.61M | 15.01M | 6.45M |
| End period cash flow | 65.62M | 4.66M | 0.75M | 0.61M | 15.01M |
| Total cash from operating activities | 100.29M | 57.96M | 70.82M | 48.52M | 58.50M |
| Issuance of capital stock | 29.04M | 119.78M | 0.00M | - | - |
| Depreciation | 22.34M | 19.77M | 18.23M | 16.56M | 16.53M |
| Other cashflows from investing activities | -12.68M | 0.67M | 2.10M | 0.87M | 0.54M |
| Dividends paid | 0.00M | 35.75M | 38.42M | 30.80M | 17.36M |
| Change to inventory | -0.88M | -1.15M | 4.43M | -8.12M | -0.24M |
| Change to account receivables | -8.55M | -25.48M | -14.30M | -16.79M | -7.71M |
| Sale purchase of stock | -29.04M | -55.18M | 0.00M | - | - |
| Other cashflows from financing activities | -0.50M | -16.02M | -15.92M | -11.42M | -13.34M |
| Capital expenditures | 19.58M | 16.37M | 14.56M | 16.77M | 9.28M |
| Change in working capital | 6.38M | -29.41M | 15.60M | -18.72M | -1.47M |
| Stock based compensation | 13.85M | 131.49M | -6.09M | -3.38M | 13.03M |
| Other non cash items | 5.43M | 7.14M | 5.35M | 4.40M | 2.08M |
| Free cash flow | 80.71M | 41.59M | 56.26M | 31.75M | 49.22M |
Sector: Healthcare Industry: Medical Care Facilities
|
Stock Name
|
Change
(USD) |
Price
(USD) |
Trailing
PE (x) |
Forward
PE (x) |
Price Sales
TTM (x) |
Price to Book Value (x)
|
Enterprise Value
to Revenue (x) |
Enterprise Value
to EBITDA (x) |
|---|---|---|---|---|---|---|---|---|
| GRDN Guardian Pharmacy Services, Inc. |
2.52 6.32% |
42.39 | 44.44 | 32.47 | 2.08 | 11.99 | 1.98 | 24.12 |
| HCA HCA Healthcare, Inc. |
-12.49 2.46% |
494.99 | 14.27 | 13.46 | 1.21 | 291.34 | 1.83 | 8.99 |
| THC Tenet Healthcare Corporation |
-3.13 1.09% |
283.33 | 10.08 | 12.66 | 0.96 | 4.57 | 1.43 | 5.80 |
| FSNUY Fresenius SE & Co KGaA ADR |
0.06 0.42% |
14.62 | 16.87 | 9.44 | 0.42 | 0.78 | 0.79 | 5.37 |
| JDHIY JD Health International Inc |
- -% |
5.28 | 62.50 | 35.97 | 0.30 | 2.32 | 0.16 | 3.90 |
Guardian Pharmacy Services, Inc., a pharmacy service company, provides a suite of technology-enabled services to help residents of long-term health care facilities (LTCFs) in the United States. The company's individualized clinical, drug dispensing, and administration capabilities are used to serve the needs of residents in lower acuity LTCFs, such as assisted living facilities, behavioral health facilities, and group homes. Its Guardian Compass includes dashboards created using data from its data warehouse to help its local pharmacies plan, track, and optimize their business operations; GuardianShield Programs for LTCFs; Order Entry QA Analyzer, which utilizes real-time rules- engine technology to examine prescriptions and detect omissions and/or errors before they become a customer service problem; and Medication Spend Analyzer to break down the monthly drug spending for each of the LTCFs. Guardian Pharmacy Services, Inc. was founded in 2003 and is headquartered in Atlanta, Georgia.

300 Galleria Parkway SE, Atlanta, GA, United States, 30339

404 810 0089

3600
| Name | Title | Year Born |
|---|---|---|
| Mr. Fred P. Burke | CEO, President & Director | 1950 |
| Mr. David K. Morris | CFO, Executive VP & Director | 1964 |
| Mr. Kendall Forbes R.Ph. | Executive Vice President of Sales & Operations | 1957 |
| Mr. David Martin | Senior VP of Technology, Data & Senior Security Officer | NA |
| Ms. Ashley Stockton | Head of Investor Relations & Senior Director | NA |
| Mr. Douglas Towns | SVP of General Counsel & Senior Compliance Officer | NA |
| Ms. Vicki Crabtree | Vice President of Human Resources | NA |
| Mr. Jeff Tuch CPA | SVP of Purchasing & Pricing Analytics | NA |
| Mr. Will Mudd CPA | SVP of Finance | NA |
| Bob Weir R.Ph | SVP of Operations & Regulatory Support | NA |
Disclaimer - (*)This information, including any data, is sourced from Unicorn Data Services SAS, trading as EOD Historical Data (“EODHD”) on an ‘as is’ basis, using their API. We cannot guarantee the completeness or validity of the information and data provided on this page, as well as via the API. In some cases, the data may include analyst ratings or recommendations sourced through the EODHD API, which are intended solely for general information purposes.
This information does not consider your personal objectives, financial situation, or needs. Kalkine is not liable for any errors or omissions in the information provided or for any actions taken in reliance on it. You should seek advice from a financial adviser, stockbroker or other professional adviser (including taxation and legal advice) as necessary before acting on this information.

Download a free report with stock ideas and industry insights for general information.
Download Free Report Now →


Basic Materials
 +0.61%
Communication Services
 -0.21%

Consumer Cyclical
-0.26%

Consumer Defensive
-0.37%

Energy
+0.23%

Financial Services
-0.43%
Financials
+0.39%

Healthcare
+0.88%

Industrials
+0.36%

Real Estate
-0.51%

Technology
+1.35%

Utilities
+0.19%
Note: Daily price change (%) by sector excluding stocks with +/-90% daily price change. Companies above $500 million market capitalization are considered.
 Portfolio
 Watchlist


 Please wait processing your request...