 CA
 NZ
 UK
 AU
 IND

 US


…
Huntington Ingalls Industries, Inc. designs, builds, overhauls, and repairs military ships in the United States. It operates through three segments: Ingalls, Newport News, and Mission Technologies. The company is involved in the design and construction of non-nuclear ships comprising amphibious assault ships, surface combatants, and national security cutters for the U.S. Navy and U.S. Coast Guard. It also provides nuclear-powered ships, such as aircraft carriers and submarines, as well as refueling and overhaul, and inactivation services of nuclear-powered aircraft carriers. In addition, the company offers naval nuclear support services, including fleet services comprising design, construction, maintenance, and disposal activities for in-service the U.S. Navy nuclear ships; and maintenance services on nuclear reactor prototypes. Further, the company provides C5ISR systems and operations; application of artificial intelligence and machine learning to battlefield decisions; defensive and offensive cyberspace strategies and electronic warfare; uncrewed autonomous systems; live, virtual, and constructive solutions; platform modernization; and critical nuclear operations. The company has a strategic partnership with HD Hyundai Heavy Industries to implement intelligent mechanized welding systems at Huntington Ingalls Industries, Inc.'s Ingalls Shipbuilding division. Huntington Ingalls Industries, Inc. was founded in 1886 and is headquartered in Newport News, Virginia.
Source: TradingView
The charts and visual representations are sourced from TradingView through embedded widgets. For any issues with chart display, please visit the TradingView website
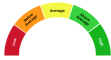
A unique technical analysis driven score developed by Kalkine showing momentum in stock prices based on select technical indicators identified.
Huntington Ingalls Industries builds and maintains U.S. Navy ships and provides related defense services, focusing on complex vessels and long-term sustainment contracts. Long-term growth is driven by steady U.S. naval shipbuilding and maintenance spending, multi-year ship programs and recurring services that may support revenue visibility and steady cash generation.
Key risks include dependence on U.S. defense budgets and congressional appropriations, program execution and cost-overrun exposure on large contracts, supply-chain and labor constraints and pension or regulatory liabilities that could pressure margins.

Note: The summary and risk score provided above is created by AI and should not be construed as a recommendation of Kalkine.


| Breakdown | 2025-12-31 | 2024-12-31 | 2023-12-31 | 2022-12-31 | 2021-12-31 |
|---|---|---|---|---|---|
| Type | yearly | yearly | yearly | yearly | yearly |
| Date | 2025-12-31 | 2024-12-31 | 2023-12-31 | 2022-12-31 | 2021-12-31 |
| Income before tax | 777.00M | 643.00M | 853.00M | 719.00M | 622.00M |
| Net income | 605.00M | 550.00M | 681.00M | 579.00M | 544.00M |
| Selling general administrative | 977.00M | 973.00M | 1022.00M | 924.00M | 898.00M |
| Selling and marketing expenses | - | - | 148.00M | - | - |
| Gross profit | 1585.00M | 1450.00M | 1646.00M | 1440.00M | 1368.00M |
| Reconciled depreciation | 329.00M | 326.00M | 347.00M | 358.00M | 293.00M |
| Ebit | 882.00M | 738.00M | 948.00M | 821.00M | 711.00M |
| Ebitda | 1211.00M | 1064.00M | 1295.00M | 1179.00M | 1004.00M |
| Depreciation and amortization | 329.00M | 326.00M | 347.00M | 358.00M | 293.00M |
| Non operating income net other | - | - | - | -20.00M | 17.00M |
| Operating income | 608.00M | 535.00M | 781.00M | 773.00M | 513.00M |
| Other operating expenses | 11876.00M | 11000.00M | 10673.00M | 10159.00M | 9052.00M |
| Interest expense | 105.00M | 95.00M | 95.00M | 102.00M | 89.00M |
| Tax provision | 172.00M | 93.00M | 172.00M | 140.00M | 78.00M |
| Interest income | 105.00M | 95.00M | - | 102.00M | 89.00M |
| Net interest income | -105.00M | -95.00M | -95.00M | -102.00M | -89.00M |
| Income tax expense | 172.00M | 93.00M | 172.00M | 140.00M | 78.00M |
| Total revenue | 12484.00M | 11535.00M | 11454.00M | 10676.00M | 9524.00M |
| Total operating expenses | 977.00M | 915.00M | 865.00M | 923.00M | 896.00M |
| Cost of revenue | 10899.00M | 10085.00M | 9808.00M | 9236.00M | 8156.00M |
| Total other income expense net | 169.00M | 108.00M | 72.00M | -74.00M | 109.00M |
| Net income from continuing ops | 605.00M | 550.00M | 681.00M | 579.00M | 544.00M |
| Net income applicable to common shares | 605.00M | 550.00M | - | 579.00M | 544.00M |
| Breakdown | 2025-12-31 | 2024-12-31 | 2023-12-31 | 2022-12-31 | 2021-12-31 |
|---|---|---|---|---|---|
| Type | yearly | yearly | yearly | yearly | yearly |
| Date | 2025-12-31 | 2024-12-31 | 2023-12-31 | 2022-12-31 | 2021-12-31 |
| Total assets | 12749.00M | 12141.00M | 11215.00M | 10857.00M | 10627.00M |
| Intangible assets | 694.00M | 782.00M | 891.00M | 1019.00M | 1159.00M |
| Other current assets | 77.00M | 90.00M | 83.00M | 50.00M | 50.00M |
| Total liab | 7676.00M | 7475.00M | 7122.00M | 7368.00M | 7819.00M |
| Total stockholder equity | 5073.00M | 4666.00M | 4093.00M | 3489.00M | 2808.00M |
| Deferred long term liab | - | - | - | 418.00M | 313.00M |
| Other current liab | 2489.00M | 1116.00M | 1186.00M | 1088.00M | 423.00M |
| Common stock | 1.00M | 1.00M | 1.00M | 1.00M | 1.00M |
| Capital stock | 1.00M | 1.00M | 1.00M | 1.00M | 1.00M |
| Retained earnings | 5487.00M | 5097.00M | 4755.00M | 4276.00M | 3891.00M |
| Other liab | - | - | - | 1721.00M | 1900.00M |
| Good will | 2650.00M | 2618.00M | 2618.00M | 2618.00M | 2628.00M |
| Other assets | 4461.00M | 208.00M | - | 994.00M | 702.00M |
| Cash | 774.00M | 831.00M | 430.00M | 467.00M | 627.00M |
| Cash and equivalents | 774.00M | 831.00M | - | 467.00M | 627.00M |
| Total current liabilities | 3045.00M | 2991.00M | 3032.00M | 2895.00M | 2427.00M |
| Current deferred revenue | - | 774.00M | 1063.00M | 766.00M | 651.00M |
| Net debt | 2372.00M | 2577.00M | 2243.00M | 2684.00M | 2865.00M |
| Short term debt | 0.00M | 503.00M | 229.00M | 399.00M | 750.00M |
| Short long term debt | - | 503.00M | 231.00M | 399.00M | - |
| Short long term debt total | 3146.00M | 3408.00M | 2673.00M | 3151.00M | 3492.00M |
| Other stockholder equity | -362.00M | -404.00M | -241.00M | -189.00M | -161.00M |
| Property plant equipment | 3993.00M | 3689.00M | - | 3198.00M | 3107.00M |
| Total current assets | 3451.00M | 3228.00M | 2880.00M | 2746.00M | 2790.00M |
| Net tangible assets | - | - | - | 3489.00M | 2808.00M |
| Net receivables | 2381.00M | 2099.00M | 2181.00M | 2046.00M | 1952.00M |
| Long term debt | 2700.00M | 2700.00M | 2214.00M | 2506.00M | 3298.00M |
| Inventory | 219.00M | 208.00M | 186.00M | 183.00M | 161.00M |
| Accounts payable | 556.00M | 598.00M | 554.00M | 642.00M | 603.00M |
| Accumulated other comprehensive income | -53.00M | -28.00M | -422.00M | -599.00M | -923.00M |
| Common stock total equity | - | - | - | 1.00M | 1.00M |
| Retained earnings total equity | - | - | - | 4276.00M | 3891.00M |
| Treasury stock | - | - | - | -2211.00M | -2159.00M |
| Non currrent assets other | -2233.00M | 1591.00M | 1268.00M | 994.00M | 702.00M |
| Non current assets total | 4837.00M | 8913.00M | 8335.00M | 8111.00M | 7837.00M |
| Capital lease obligations | 223.00M | 205.00M | 228.00M | 246.00M | 194.00M |
| Long term debt total | 2700.00M | 2700.00M | - | 2506.00M | 3298.00M |
| Breakdown | 2025-12-31 | 2024-12-31 | 2023-12-31 | 2022-12-31 | 2021-12-31 |
|---|---|---|---|---|---|
| Type | yearly | yearly | yearly | yearly | yearly |
| Date | 2025-12-31 | 2024-12-31 | 2023-12-31 | 2022-12-31 | 2021-12-31 |
| Investments | 5.00M | -348.00M | -201.00M | -5.00M | -22.00M |
| Change to liabilities | - | - | - | 121.00M | -33.00M |
| Total cashflows from investing activities | -521.00M | -348.00M | - | -268.00M | -1954.00M |
| Net borrowings | -500.00M | 771.00M | - | -376.00M | 1603.00M |
| Total cash from financing activities | -732.00M | 356.00M | -771.00M | -658.00M | 1309.00M |
| Change to operating activities | - | - | - | -107.00M | -166.00M |
| Net income | 605.00M | 550.00M | 681.00M | 579.00M | 544.00M |
| Change in cash | -57.00M | 401.00M | -37.00M | -160.00M | 115.00M |
| Begin period cash flow | 831.00M | 430.00M | 467.00M | 627.00M | 512.00M |
| End period cash flow | 774.00M | 831.00M | 430.00M | 467.00M | 627.00M |
| Total cash from operating activities | 1196.00M | 393.00M | 970.00M | 766.00M | 760.00M |
| Depreciation | 329.00M | 326.00M | 347.00M | 358.00M | 293.00M |
| Other cashflows from investing activities | -360.00M | 19.00M | 17.00M | 21.00M | -1603.00M |
| Dividends paid | 213.00M | 206.00M | 200.00M | 192.00M | 186.00M |
| Change to inventory | -11.00M | -22.00M | -3.00M | -22.00M | -25.00M |
| Change to account receivables | -202.00M | 256.00M | 168.00M | -196.00M | 58.00M |
| Sale purchase of stock | -14.00M | -162.00M | -75.00M | -52.00M | -101.00M |
| Other cashflows from financing activities | -5.00M | -47.00M | -16.00M | 10.00M | -29.00M |
| Change to netincome | - | - | - | -70.00M | 167.00M |
| Capital expenditures | 402.00M | 367.00M | 292.00M | 284.00M | 331.00M |
| Change receivables | - | - | - | 196.00M | 58.00M |
| Cash flows other operating | - | - | - | -90.00M | -214.00M |
| Cash and cash equivalents changes | - | - | - | -1692.00M | 115.00M |
| Change in working capital | 39.00M | -372.00M | 15.00M | -249.00M | -214.00M |
| Stock based compensation | 54.00M | 23.00M | 34.00M | 36.00M | 33.00M |
| Other non cash items | -34.00M | -12.00M | 6.00M | 40.00M | 6.00M |
| Free cash flow | 794.00M | 26.00M | 678.00M | 482.00M | 429.00M |
Sector: Industrials Industry: Aerospace & Defense
|
Stock Name
|
Change
(USD) |
Price
(USD) |
Trailing
PE (x) |
Forward
PE (x) |
Price Sales
TTM (x) |
Price to Book Value (x)
|
Enterprise Value
to Revenue (x) |
Enterprise Value
to EBITDA (x) |
|---|---|---|---|---|---|---|---|---|
| HII Huntington Ingalls Industries Inc |
36.95 13.23% |
316.21 | 16.66 | 12.99 | 0.84 | 2.08 | 1.06 | 11.04 |
| SPCX Space Exploration Technologies Corp. Class A Common Stock |
-1.34 0.92% |
143.89 | - | 200.00 | 82.08 | 15.35 | 82.13 | 500.95 |
| GE GE Aerospace |
11.92 3.96% |
313.05 | 37.45 | 35.09 | 6.29 | 18.68 | 6.70 | 27.10 |
| EADSF Airbus Group SE |
1.95 0.89% |
220.00 | 25.70 | 22.32 | 2.30 | 5.91 | 1.97 | 13.60 |
| BA The Boeing Company |
5.51 3.30% |
172.65 | 88.37 | 153.85 | 1.93 | 31.61 | 2.21 | 26.81 |
Huntington Ingalls Industries, Inc. designs, builds, overhauls, and repairs military ships in the United States. It operates through three segments: Ingalls, Newport News, and Mission Technologies. The company is involved in the design and construction of non-nuclear ships comprising amphibious assault ships, surface combatants, and national security cutters for the U.S. Navy and U.S. Coast Guard. It also provides nuclear-powered ships, such as aircraft carriers and submarines, as well as refueling and overhaul, and inactivation services of nuclear-powered aircraft carriers. In addition, the company offers naval nuclear support services, including fleet services comprising design, construction, maintenance, and disposal activities for in-service the U.S. Navy nuclear ships; and maintenance services on nuclear reactor prototypes. Further, the company provides C5ISR systems and operations; application of artificial intelligence and machine learning to battlefield decisions; defensive and offensive cyberspace strategies and electronic warfare; uncrewed autonomous systems; live, virtual, and constructive solutions; platform modernization; and critical nuclear operations. The company has a strategic partnership with HD Hyundai Heavy Industries to implement intelligent mechanized welding systems at Huntington Ingalls Industries, Inc.'s Ingalls Shipbuilding division. Huntington Ingalls Industries, Inc. was founded in 1886 and is headquartered in Newport News, Virginia.

4101 Washington Avenue, Newport News, VA, United States, 23607

757 380 2000

45000
| Name | Title | Year Born |
|---|---|---|
| Mr. Christopher D. Kastner | Pres, CEO & Director | 1964 |
| Mr. C. Michael Petters | Exec. Vice Chairman | 1960 |
| Mr. Thomas E. Stiehle | Exec. VP & CFO | 1966 |
| Mr. Chad N. Boudreaux | Exec. VP & Chief Legal Officer | 1974 |
| Ms. Jennifer R. Boykin | Exec. VP & Pres of Newport News Shipbuilding | 1964 |
| Mr. Andy Edgar Green III | Exec. VP & Pres of Mission Technologies | 1966 |
| Mr. Nicolas G. Schuck | Corp. VP, Chief Accounting Officer & Controller | 1974 |
| Mr. Todd Borkey | Exec. VP & CTO | NA |
| Mr. Bharat B. Amin | Exec. VP & Chief Information Officer | 1955 |
| Ms. Christie Thomas | VP of Investor Relations | NA |
Disclaimer - (*)This information, including any data, is sourced from Unicorn Data Services SAS, trading as EOD Historical Data (“EODHD”) on an ‘as is’ basis, using their API. We cannot guarantee the completeness or validity of the information and data provided on this page, as well as via the API. In some cases, the data may include analyst ratings or recommendations sourced through the EODHD API, which are intended solely for general information purposes.
This information does not consider your personal objectives, financial situation, or needs. Kalkine is not liable for any errors or omissions in the information provided or for any actions taken in reliance on it. You should seek advice from a financial adviser, stockbroker or other professional adviser (including taxation and legal advice) as necessary before acting on this information.

Download a free report with stock ideas and industry insights for general information.
Download Free Report Now →


Basic Materials
 -0.52%
Communication Services
 +0.32%

Consumer Cyclical
+1.01%

Consumer Defensive
+0.00%

Energy
+0.01%

Financial Services
+0.62%
Financials
-2.62%

Healthcare
+0.51%

Industrials
+0.71%

Real Estate
+0.72%

Technology
-0.46%

Utilities
+0.54%
Note: Daily price change (%) by sector excluding stocks with +/-90% daily price change. Companies above $500 million market capitalization are considered.
 Portfolio
 Watchlist


 Please wait processing your request...