 CA
 NZ
 UK
 AU
 IND

 US


…
QXO, Inc. distributes roofing, waterproofing and complementary building products in the United States and Canada. It offers roofing and siding materials for residential construction, such as asphalt shingles, metal roofing, wood roofing, tile roofing, slate roofing, roofing accessories, and roofing insulation; and siding materials, including vinyl siding aluminum siding, steel siding, fiber cement siding, wood and composite siding, trim and accessories, and gutters and accessories. The company also provides commercial roofing and siding products built-up roofing, modified roofing, EPDM roofing, PVC roofing, low-slope metal roofing TPO roofing, and commercial accessories; commercial waterproofing, concrete restoration and parking, public works, DOT and industrial, fire protection, wall systems, and safety and tools, as well as glass, glazing, and fenestration. In addition, it offers building materials; exterior and interior materials; and tools and equipment. The company provides its products under Atlas, Carlisle, CertainTeed, Elevate, Exterior Portfolio, GAF, IKO, James Hardie, LP SmartSide, Owens Corning, Royal, Tamko, TRI-BUILT, and Velux brands. It serves professional contractors, home builders, building owners, lumberyards, and retailers. The company was formerly known as SilverSun Technologies, Inc. and changed its name to QXO, Inc. in June 2024. QXO, Inc. is headquartered in Greenwich, Connecticut.
Source: TradingView
The charts and visual representations are sourced from TradingView through embedded widgets. For any issues with chart display, please visit the TradingView website
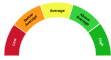
A unique technical analysis driven score developed by Kalkine showing momentum in stock prices based on select technical indicators identified.
QXO, Inc. is listed on the NYSE, but publicly available information about its core business, products and markets is limited. Major long-term growth drivers and competitive positioning are not clearly disclosed, so investors should consult the company's SEC filings and investor presentations for details; the stock may attract those seeking exposure to underfollowed listings, though apparent opportunities cannot be confirmed from available sources.
Key investment risks include limited disclosure and transparency, likely low trading liquidity, governance and execution uncertainty, and potential for heightened share-price volatility.

Note: The summary and risk score provided above is created by AI and should not be construed as a recommendation of Kalkine.


| Breakdown | 2025-12-31 | 2024-12-31 | 2023-12-31 | 2022-12-31 | 2021-12-31 |
|---|---|---|---|---|---|
| Type | yearly | yearly | yearly | yearly | yearly |
| Date | 2025-12-31 | 2024-12-31 | 2023-12-31 | 2022-12-31 | 2021-12-31 |
| Income before tax | -337.10M | 50.81M | -1.37M | -0.47M | 0.04M |
| Net income | -279.40M | 27.97M | -1.07M | -0.28M | -0.13M |
| Selling general administrative | 1394.80M | 34.51M | 10.26M | 9.65M | 9.84M |
| Selling and marketing expenses | - | 55.66M | 8.85M | 7.75M | 6.72M |
| Gross profit | 1149.60M | 22.93M | 21.61M | 17.96M | 17.21M |
| Reconciled depreciation | 423.10M | 1.12M | 1.13M | 1.76M | 1.39M |
| Ebit | -163.60M | 50.87M | -1.29M | -0.39M | 0.09M |
| Ebitda | 259.50M | 51.99M | -0.29M | 1.37M | 1.49M |
| Depreciation and amortization | 423.10M | 1.12M | 1.00M | 1.76M | 1.39M |
| Operating income | -57.00M | -71.00M | -1.31M | -0.39M | -0.23M |
| Other operating expenses | 6899.20M | 127.87M | 55.83M | 45.37M | 41.93M |
| Interest expense | 173.50M | 0.06M | 0.06M | 0.09M | 0.05M |
| Tax provision | -57.70M | 22.84M | -0.30M | -0.19M | 0.18M |
| Interest income | 125.80M | 121.87M | 0.02M | 0.09M | - |
| Net interest income | -47.70M | 121.81M | -0.06M | -0.09M | -0.05M |
| Income tax expense | -57.70M | 22.84M | -0.30M | -0.19M | 0.18M |
| Total revenue | 6842.20M | 56.87M | 54.52M | 44.99M | 41.70M |
| Total operating expenses | 1206.60M | 93.93M | 22.93M | 18.35M | 17.44M |
| Cost of revenue | 5692.60M | 33.94M | 32.90M | 27.02M | 24.49M |
| Total other income expense net | -280.10M | 121.81M | -0.06M | -0.09M | 0.27M |
| Net income from continuing ops | -279.40M | 27.97M | -1.07M | -0.28M | -0.13M |
| Net income applicable to common shares | -388.30M | -23.03M | -1.07M | -0.28M | - |
| Breakdown | 2025-12-31 | 2024-12-31 | 2023-12-31 | 2022-12-31 | 2021-12-31 |
|---|---|---|---|---|---|
| Type | yearly | yearly | yearly | yearly | yearly |
| Date | 2025-12-31 | 2024-12-31 | 2023-12-31 | 2022-12-31 | 2021-12-31 |
| Total assets | 15887.30M | 5098.26M | 20.50M | 21.44M | 18.00M |
| Intangible assets | 3819.10M | 4.02M | 4.92M | 4.27M | 3.49M |
| Other current assets | 83.70M | 7.29M | 2.68M | 3.09M | 1.69M |
| Total liab | 6180.50M | 45.36M | 13.02M | 11.89M | 8.64M |
| Total stockholder equity | 9706.80M | 5052.90M | 7.47M | 9.55M | 9.36M |
| Other current liab | 574.30M | 11.69M | 2.68M | 2.46M | 1.77M |
| Common stock | 0.01M | 0.00M | 0.00M | 0.00M | 0.00M |
| Capital stock | 1056.70M | 498.62M | 0.00M | 0.00M | 0.00M |
| Retained earnings | -394.50M | -6.23M | -1.95M | -0.88M | -0.59M |
| Good will | 5111.30M | 1.16M | 1.14M | 1.14M | 1.01M |
| Other assets | 32.40M | 2.79M | 0.00M | 1.29M | 0.00M |
| Cash | 2361.60M | 5068.50M | 6.14M | 8.01M | 6.81M |
| Total current liabilities | 1550.00M | 45.10M | 11.52M | 10.75M | 7.39M |
| Current deferred revenue | - | 2.90M | 3.16M | 3.76M | 2.48M |
| Net debt | 1552.90M | -5067.93M | -3.52M | -5.61M | -4.53M |
| Short term debt | 156.70M | 0.32M | 1.12M | 1.27M | 1.03M |
| Short long term debt | - | - | 0.70M | 0.78M | 0.40M |
| Short long term debt total | 3914.50M | 0.58M | 2.62M | 2.40M | 2.29M |
| Other stockholder equity | 9046.90M | 4560.50M | 9.42M | 10.43M | 9.95M |
| Property plant equipment | 1378.20M | 0.70M | 1.03M | 1.04M | - |
| Total current assets | 5546.30M | 5089.58M | 11.80M | 13.70M | 10.71M |
| Net receivables | 1603.70M | 13.79M | 2.97M | 2.60M | 2.21M |
| Long term debt | 3057.30M | 0.00M | 0.99M | 0.67M | 0.57M |
| Inventory | 1497.30M | 0.00M | -0.00M | - | 0.00M |
| Accounts payable | 819.00M | 6.19M | 4.56M | 3.27M | 2.04M |
| Accumulated other comprehensive income | -2.30M | - | 0.00M | 0.00M | 0.00M |
| Non currrent assets other | 1409.22M | 0.19M | 0.17M | 0.19M | 0.19M |
| Non current assets total | 10341.00M | 8.68M | 8.70M | 7.74M | 7.29M |
| Capital lease obligations | 857.20M | 0.58M | 0.92M | 0.95M | 1.32M |
| Long term debt total | 3196.00M | 0.19M | 1.24M | 1.07M | - |
| Breakdown | 2025-12-31 | 2024-12-31 | 2023-12-31 | 2022-12-31 | 2021-12-31 |
|---|---|---|---|---|---|
| Type | yearly | yearly | yearly | yearly | yearly |
| Date | 2025-12-31 | 2024-12-31 | 2023-12-31 | 2022-12-31 | 2021-12-31 |
| Investments | - | -0.10M | -0.40M | -0.19M | -0.51M |
| Total cashflows from investing activities | -10630.30M | -0.10M | -0.40M | -0.19M | -0.51M |
| Net borrowings | 3069.60M | -1.87M | -1.00M | -0.66M | -0.60M |
| Total cash from financing activities | 7662.80M | 4981.08M | -2.05M | -0.66M | 0.50M |
| Net income | -279.40M | 27.97M | -1.07M | -0.28M | -0.13M |
| Change in cash | -2706.60M | 5065.86M | -1.87M | 1.19M | 0.22M |
| Begin period cash flow | 5072.00M | 6.14M | 8.01M | 6.81M | 6.60M |
| End period cash flow | 2365.40M | 5072.00M | 6.14M | 8.01M | 6.81M |
| Total cash from operating activities | 261.40M | 84.88M | 0.58M | 2.04M | 0.23M |
| Issuance of capital stock | 4814.10M | 5032.64M | 0.00M | 0.00M | 4.18M |
| Depreciation | 423.10M | 1.12M | 1.00M | 1.76M | 1.39M |
| Other cashflows from investing activities | 4.40M | - | -0.28M | -0.15M | 0.25M |
| Dividends paid | 104.80M | 49.65M | 1.05M | 0.00M | 3.08M |
| Change to inventory | 287.80M | 0.00M | - | - | - |
| Change to account receivables | -38.00M | 0.18M | 0.10M | -0.55M | -0.53M |
| Sale purchase of stock | 4833.00M | 5032.64M | - | 0.00M | - |
| Other cashflows from financing activities | -20.50M | 981.49M | 0.00M | -0.19M | -0.51M |
| Capital expenditures | 78.20M | 0.10M | 0.12M | 0.04M | 0.11M |
| Change in working capital | -124.40M | 22.12M | 0.71M | 0.34M | -1.16M |
| Stock based compensation | 144.50M | 34.51M | 0.04M | 0.18M | 0.44M |
| Other non cash items | 158.20M | 0.31M | 0.24M | 0.16M | -0.37M |
| Free cash flow | 183.20M | 84.78M | 0.46M | 2.00M | 0.11M |
Sector: Industrials Industry: Industrial Distribution
|
Stock Name
|
Change
(USD) |
Price
(USD) |
Trailing
PE (x) |
Forward
PE (x) |
Price Sales
TTM (x) |
Price to Book Value (x)
|
Enterprise Value
to Revenue (x) |
Enterprise Value
to EBITDA (x) |
|---|---|---|---|---|---|---|---|---|
| QXO QXO, Inc. |
0.95 8.11% |
12.66 | - | 18.94 | 1.20 | 1.35 | 1.81 | 40.23 |
| GWW WW Grainger Inc |
91.53 6.55% |
1489.52 | 32.37 | 24.88 | 3.18 | 14.57 | 3.31 | 20.64 |
| FAST Fastenal Company |
0.88 1.68% |
53.21 | 42.23 | 36.36 | 6.48 | 13.95 | 6.51 | 29.08 |
| FERG Ferguson Plc |
6.57 2.71% |
248.56 | 25.91 | 20.83 | 1.71 | 9.03 | 1.86 | 18.49 |
| WSO Watsco Inc |
7.83 2.51% |
319.52 | 28.08 | 27.93 | 2.27 | 7.40 | 2.31 | 19.57 |
QXO, Inc. distributes roofing, waterproofing and complementary building products in the United States and Canada. It offers roofing and siding materials for residential construction, such as asphalt shingles, metal roofing, wood roofing, tile roofing, slate roofing, roofing accessories, and roofing insulation; and siding materials, including vinyl siding aluminum siding, steel siding, fiber cement siding, wood and composite siding, trim and accessories, and gutters and accessories. The company also provides commercial roofing and siding products built-up roofing, modified roofing, EPDM roofing, PVC roofing, low-slope metal roofing TPO roofing, and commercial accessories; commercial waterproofing, concrete restoration and parking, public works, DOT and industrial, fire protection, wall systems, and safety and tools, as well as glass, glazing, and fenestration. In addition, it offers building materials; exterior and interior materials; and tools and equipment. The company provides its products under Atlas, Carlisle, CertainTeed, Elevate, Exterior Portfolio, GAF, IKO, James Hardie, LP SmartSide, Owens Corning, Royal, Tamko, TRI-BUILT, and Velux brands. It serves professional contractors, home builders, building owners, lumberyards, and retailers. The company was formerly known as SilverSun Technologies, Inc. and changed its name to QXO, Inc. in June 2024. QXO, Inc. is headquartered in Greenwich, Connecticut.
| Name | Title | Year Born |
|---|---|---|
| Mr. Bradley S. Jacobs | CEO & Chairman | 1957 |
| Mr. Ihsan Essaid | Chief Financial Officer | 1967 |
| Mr. Valeri Liborski | Chief Technology Officer | 1968 |
| Mr. Christopher J. Signorello | Chief Legal Officer | 1973 |
| Mr. Kenneth J. West | President & COO | 1977 |
| Mr. Mark Andrew Falzon Sant Manduca C.F.A. | Chief Investment Officer | NA |
| Ms. Madeline Ortero | Interim Chief Accounting Officer | 1976 |
| Ms. Josephine Berisha | Chief Human Resources Officer | NA |
| Mr. Matthew Jeremy Fassler | Chief Strategy Officer | 1971 |
| Mr. Larry Augello | President of Midwest Division | NA |
Disclaimer - (*)This information, including any data, is sourced from Unicorn Data Services SAS, trading as EOD Historical Data (“EODHD”) on an ‘as is’ basis, using their API. We cannot guarantee the completeness or validity of the information and data provided on this page, as well as via the API. In some cases, the data may include analyst ratings or recommendations sourced through the EODHD API, which are intended solely for general information purposes.
This information does not consider your personal objectives, financial situation, or needs. Kalkine is not liable for any errors or omissions in the information provided or for any actions taken in reliance on it. You should seek advice from a financial adviser, stockbroker or other professional adviser (including taxation and legal advice) as necessary before acting on this information.

Download a free report with stock ideas and industry insights for general information.
Download Free Report Now →


Basic Materials
 +2.10%
Communication Services
+1.48%

Consumer Cyclical
+2.12%

Consumer Defensive
+1.59%

Energy
 -2.52%

Financial Services
+1.11%
Financials
-6.05%

Healthcare
+2.12%

Industrials
-0.12%

Real Estate
+1.25%

Technology
-0.07%

Utilities
+0.57%
Note: Daily price change (%) by sector excluding stocks with +/-90% daily price change. Companies above $500 million market capitalization are considered.
 Portfolio
 Watchlist


 Please wait processing your request...