 CA
 NZ
 UK
 AU
 IND

 US


…
Akzo Nobel N.V. produces and sells paints and coatings worldwide. It operates through Decorative Paints and Performance Coatings segments. The company offers decorative paints, including paints, enamels, varnishes, and surface preparation products; and a range of mixing machines, color concepts and advice, and training for applicators. It also provides performance coatings that produces engineered coatings designed to deliver functional properties, such as corrosion and fouling control, anti-scratch performance, and fire protection to protect and enhance ships, cars, aircraft, yachts, and architectural components, consumer goods, and oil and gas facilities. The company offers its products under the AkzoNobel, Alabastine, Alba, Andercol, Apla, Armstead Trade, Astral, Astral Batiment, AwlGrip, Brikol, Bruguer, Cetabever, Cetol, Chemcraft, Colourland Paints, CONSOLAN, Coral, Cromadex, Cuprinol, Dulux, Dynacoat, Flexa, Glitsa, Grip-Gard, Hammerite, Herbol, Inca, Innenweis, Interlux, International, Interpon, Lesonal, Levis, Luxol, Mactra, Marshall, Mauvilac, Maxilite, Modern Classikk, Molto, Nordsjo, Oxirite, Pintuco, Pinotex, Polycell, Polyfilla, Procolor, Protecto, Relest, Resicoat, Sadolin, Salcomix, Savana, Sea Hawk, Sikkens, Sparlack, Taubmans, Titanlux, Trimetal, U-Tech, Vivechrom, VPowdertech, Wanda, Xyladecor, and Xylazel brands. The company serves energy, packaging, infrastructure, and shipbuilding and maintenance industries, as well as general industries, such as agricultural and construction equipment, construction-related steel, metal fabrication, pipes, appliances, and transportation. The company was formerly known as Akzo NV and changed its name to Akzo Nobel N.V. in 1994. Akzo Nobel N.V. was founded in 1646 and is headquartered in Amsterdam, the Netherlands.
Source: TradingView
The charts and visual representations are sourced from TradingView through embedded widgets. For any issues with chart display, please visit the TradingView website
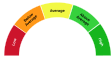
A unique technical analysis driven score developed by Kalkine showing momentum in stock prices based on select technical indicators identified.
Akzo Nobel N.V. (ADR AKZOY) is a global paints and coatings company supplying decorative paints and performance coatings to construction, industrial and automotive customers. Long-term growth drivers include demand from construction and manufacturing, expansion in emerging markets, and innovation in sustainable coatings and surface technologies that could support margin resilience. Investors may find the company attractive for its scale, brand portfolio and diversified end-market exposure.
Material risks include raw-material price volatility, cyclical demand in construction and automotive, intense competition and regulatory or environmental-compliance costs that investors should monitor.

Note: The summary and risk score provided above is created by AI and should not be construed as a recommendation of Kalkine.


| Breakdown | 2025-12-31 | 2024-12-31 | 2023-12-31 | 2022-12-31 | 2021-12-31 |
|---|---|---|---|---|---|
| Type | yearly | yearly | yearly | yearly | yearly |
| Date | 2025-12-31 | 2024-12-31 | 2023-12-31 | 2022-12-31 | 2021-12-31 |
| Income before tax | 998.00M | 838.00M | 784.00M | 602.00M | 1105.00M |
| Minority interest | -36.00M | -50.00M | -41.00M | -26.00M | -36.00M |
| Net income | 635.00M | 542.00M | 442.00M | 352.00M | 829.00M |
| Selling general administrative | 1528.00M | 1563.00M | 1538.00M | 1531.00M | 1296.00M |
| Gross profit | 4049.00M | 4337.00M | 4234.00M | 3923.00M | 3855.00M |
| Reconciled depreciation | 378.00M | 371.00M | 357.00M | 368.00M | 351.00M |
| Ebit | - | - | - | 726.00M | 1089.00M |
| Ebitda | - | - | - | 1076.00M | 1530.00M |
| Operating income | 1164.00M | 917.00M | 1029.00M | 708.00M | 1118.00M |
| Other operating expenses | - | - | - | - | -25.00M |
| Interest expense | 211.00M | 190.00M | 193.00M | 106.00M | 74.00M |
| Tax provision | 326.00M | 246.00M | 296.00M | 214.00M | 246.00M |
| Interest income | 81.00M | 88.00M | 102.00M | 54.00M | 35.00M |
| Net interest income | -124.00M | -70.00M | -98.00M | -39.00M | -39.00M |
| Income tax expense | - | - | - | 214.00M | 246.00M |
| Total revenue | 10158.00M | 10711.00M | 10668.00M | 10846.00M | 9587.00M |
| Total operating expenses | 8994.00M | 9794.00M | 9639.00M | 10138.00M | 8469.00M |
| Cost of revenue | 6109.00M | 6374.00M | 6434.00M | 6923.00M | 5732.00M |
| Discontinued operations | - | - | - | -10.00M | 6.00M |
| Net income from continuing ops | 672.00M | 592.00M | 488.00M | 388.00M | 859.00M |
| Net income applicable to common shares | - | - | - | 352.00M | 829.00M |
| Breakdown | 2025-12-31 | 2024-12-31 | 2023-12-31 | 2022-12-31 | 2021-12-31 |
|---|---|---|---|---|---|
| Type | yearly | yearly | yearly | yearly | yearly |
| Date | 2025-12-31 | 2024-12-31 | 2023-12-31 | 2022-12-31 | 2021-12-31 |
| Total assets | 13952.00M | 14249.00M | 14558.00M | 14741.00M | 13878.00M |
| Intangible assets | 2406.00M | 2606.00M | 2651.00M | 2695.00M | 2535.00M |
| Other current assets | - | - | - | 18.00M | 15.00M |
| Total liab | 9130.00M | 9433.00M | 10012.00M | 10193.00M | 8242.00M |
| Total stockholder equity | 4822.00M | 4816.00M | 4322.00M | 4333.00M | 5425.00M |
| Other current liab | 27.00M | 38.00M | - | 481.00M | 397.00M |
| Common stock | - | - | - | 87.00M | 91.00M |
| Capital stock | 86.00M | 85.00M | 85.00M | 87.00M | 91.00M |
| Retained earnings | 559.00M | - | - | 4939.00M | 5846.00M |
| Other liab | - | - | - | 1115.00M | 1379.00M |
| Good will | 1392.00M | 1443.00M | 1430.00M | 1377.00M | 1155.00M |
| Other assets | - | - | - | 1973.00M | 2558.00M |
| Cash | 1618.00M | 1302.00M | 1513.00M | 1450.00M | 1152.00M |
| Total current liabilities | 4207.00M | 4730.00M | 5706.00M | 5746.00M | 4869.00M |
| Net debt | 2970.00M | 3774.00M | 3767.00M | 4141.00M | 2099.00M |
| Short long term debt | 1112.00M | 1606.00M | 2309.00M | 2457.00M | 1469.00M |
| Other stockholder equity | - | - | - | -693.00M | -512.00M |
| Property plant equipment | - | - | - | 2259.00M | 2104.00M |
| Total current assets | 6061.00M | 5836.00M | 6044.00M | 6244.00M | 5348.00M |
| Net tangible assets | - | - | - | 261.00M | 1735.00M |
| Short term investments | 302.00M | 165.00M | 265.00M | 336.00M | 58.00M |
| Net receivables | 1990.00M | 2144.00M | 2187.00M | 2539.00M | 2436.00M |
| Long term debt | 3476.00M | 3470.00M | 2971.00M | 3134.00M | 1782.00M |
| Inventory | 1529.00M | 1721.00M | 1649.00M | 1843.00M | 1650.00M |
| Accounts payable | 2690.00M | 2740.00M | 2312.00M | 2206.00M | 2376.00M |
| Non currrent assets other | 1760.00M | 1924.00M | - | - | - |
| Non current assets total | 7891.00M | 8413.00M | 8514.00M | 8497.00M | 8530.00M |
| Capital lease obligations | 274.00M | 292.00M | 283.00M | 284.00M | 299.00M |
| Breakdown | 2025-12-31 | 2024-12-31 | 2023-12-31 | 2022-12-31 | 2021-12-31 |
|---|---|---|---|---|---|
| Type | yearly | yearly | yearly | yearly | yearly |
| Date | 2025-12-31 | 2024-12-31 | 2023-12-31 | 2022-12-31 | 2021-12-31 |
| Investments | -140.00M | 103.00M | -452.00M | -277.00M | 191.00M |
| Change to liabilities | - | - | - | -280.00M | 274.00M |
| Total cashflows from investing activities | - | - | - | -1095.00M | -134.00M |
| Net borrowings | -582.00M | -295.00M | -459.00M | 2189.00M | 553.00M |
| Total cash from financing activities | - | - | - | 1141.00M | -974.00M |
| Change to operating activities | - | - | - | -64.00M | -149.00M |
| Net income | 635.00M | 542.00M | 442.00M | 352.00M | 829.00M |
| Change in cash | 375.00M | -148.00M | 441.00M | 286.00M | -469.00M |
| Begin period cash flow | 1273.00M | 1453.00M | 1248.00M | 1112.00M | 1581.00M |
| End period cash flow | 1605.00M | 1273.00M | 1689.00M | 1398.00M | 1112.00M |
| Total cash from operating activities | 915.00M | 673.00M | 843.00M | 254.00M | 604.00M |
| Depreciation | 378.00M | 371.00M | 359.00M | 368.00M | 351.00M |
| Other cashflows from investing activities | - | - | - | 26.00M | 14.00M |
| Dividends paid | -382.00M | -385.00M | 378.00M | -379.00M | -364.00M |
| Change to inventory | 49.00M | -83.00M | 131.00M | -134.00M | -439.00M |
| Change to account receivables | - | - | - | -95.00M | -240.00M |
| Sale purchase of stock | - | 0.00M | -182.00M | -669.00M | -1135.00M |
| Other cashflows from financing activities | - | - | - | - | -28.00M |
| Change to netincome | - | - | - | 107.00M | -22.00M |
| Capital expenditures | 309.00M | 306.00M | 268.00M | 292.00M | 288.00M |
| Change in working capital | 453.00M | -199.00M | 34.00M | -573.00M | -554.00M |
| Other non cash items | -554.00M | 73.00M | 65.00M | 18.00M | 25.00M |
| Free cash flow | 606.00M | 367.00M | 575.00M | -29.00M | 317.00M |
Sector: Basic Materials Industry: Specialty Chemicals
|
Stock Name
|
Change
(USD) |
Price
(USD) |
Trailing
PE (x) |
Forward
PE (x) |
Price Sales
TTM (x) |
Price to Book Value (x)
|
Enterprise Value
to Revenue (x) |
Enterprise Value
to EBITDA (x) |
|---|---|---|---|---|---|---|---|---|
| AKZOY Akzo Nobel NV ADR |
-0.20 0.85% |
23.33 | 15.36 | 13.50 | 1.15 | 2.02 | 1.31 | 7.89 |
| LIN Linde plc Ordinary Shares |
-0.71 0.13% |
525.84 | 33.77 | 28.90 | 6.56 | 5.42 | 7.03 | 18.92 |
| AIQUY Air Liquide SA ADR |
-0.01 0.02% |
42.70 | 30.69 | 24.81 | 4.70 | 4.10 | 4.36 | 15.61 |
| AIQUF L'Air Liquide S.A |
0.01 0.00% |
213.36 | 29.78 | 22.68 | 4.54 | 3.98 | 4.50 | 15.90 |
| SHW Sherwin-Williams Co |
0.06 0.02% |
355.82 | 33.33 | 27.40 | 3.38 | 20.60 | 3.88 | 21.36 |
Akzo Nobel N.V. produces and sells paints and coatings worldwide. It operates through Decorative Paints and Performance Coatings segments. The company offers decorative paints, including paints, enamels, varnishes, and surface preparation products; and a range of mixing machines, color concepts and advice, and training for applicators. It also provides performance coatings that produces engineered coatings designed to deliver functional properties, such as corrosion and fouling control, anti-scratch performance, and fire protection to protect and enhance ships, cars, aircraft, yachts, and architectural components, consumer goods, and oil and gas facilities. The company offers its products under the AkzoNobel, Alabastine, Alba, Andercol, Apla, Armstead Trade, Astral, Astral Batiment, AwlGrip, Brikol, Bruguer, Cetabever, Cetol, Chemcraft, Colourland Paints, CONSOLAN, Coral, Cromadex, Cuprinol, Dulux, Dynacoat, Flexa, Glitsa, Grip-Gard, Hammerite, Herbol, Inca, Innenweis, Interlux, International, Interpon, Lesonal, Levis, Luxol, Mactra, Marshall, Mauvilac, Maxilite, Modern Classikk, Molto, Nordsjo, Oxirite, Pintuco, Pinotex, Polycell, Polyfilla, Procolor, Protecto, Relest, Resicoat, Sadolin, Salcomix, Savana, Sea Hawk, Sikkens, Sparlack, Taubmans, Titanlux, Trimetal, U-Tech, Vivechrom, VPowdertech, Wanda, Xyladecor, and Xylazel brands. The company serves energy, packaging, infrastructure, and shipbuilding and maintenance industries, as well as general industries, such as agricultural and construction equipment, construction-related steel, metal fabrication, pipes, appliances, and transportation. The company was formerly known as Akzo NV and changed its name to Akzo Nobel N.V. in 1994. Akzo Nobel N.V. was founded in 1646 and is headquartered in Amsterdam, the Netherlands.

Christian Neefestraat 2, Amsterdam, Netherlands, 1070 AS

31 88 969 7555

30900
| Name | Title | Year Born |
|---|---|---|
| Mr. Maarten Jan de Vries | CFO & Member of Management Board | 1962 |
| Mr. Gregoire Poux-Guillaume | CEO & Chairman of the Management Board | 1970 |
| Mr. Klaas Kruithof | Chief Technology Officer | NA |
| Mr. Kyung Seok Chae | Head Of Investor Relations | 1976 |
| Dr. Hilka Schneider | Gen. Counsel | 1970 |
| Mr. Leslie McGibbon | Global Head of Communications & Public Affairs and Corp. Director | NA |
| Ms. Joelle Boxus | Chief HR Officer | 1971 |
| Olle Werner | Sr. VP of HR | NA |
| Mr. Jaap Kuiper | Managing Director of Decorative Paints - Latin America Operations | NA |
| Mr. Amit Jain | Managing Director of Decorative Coatings - North & West Europe | 1964 |
Disclaimer - (*)This information, including any data, is sourced from Unicorn Data Services SAS, trading as EOD Historical Data (“EODHD”) on an ‘as is’ basis, using their API. We cannot guarantee the completeness or validity of the information and data provided on this page, as well as via the API. In some cases, the data may include analyst ratings or recommendations sourced through the EODHD API, which are intended solely for general information purposes.
This information does not consider your personal objectives, financial situation, or needs. Kalkine is not liable for any errors or omissions in the information provided or for any actions taken in reliance on it. You should seek advice from a financial adviser, stockbroker or other professional adviser (including taxation and legal advice) as necessary before acting on this information.

Download a free report with stock ideas and industry insights for general information.
Download Free Report Now →


Basic Materials
 -1.40%
Communication Services
-0.45%

Consumer Cyclical
-0.55%

Consumer Defensive
-0.01%

Energy
-0.01%

Financial Services
-0.40%
Financials
-0.15%

Healthcare
-1.15%

Industrials
-0.46%

Real Estate
-0.29%

Technology
-1.22%

Utilities
-0.10%
Note: Daily price change (%) by sector excluding stocks with +/-90% daily price change. Companies above $500 million market capitalization are considered.
 Portfolio
 Watchlist


 +0.55%
 Please wait processing your request...