 CA
 NZ
 UK
 AU
 IND

 US


…
Bayer Aktiengesellschaft operates as a life science company in Europe, the Middle East, Africa, Germany, Switzerland, North America, the United States, the Asia Pacific, China, Latin America, and Brazil. It operates through Pharmaceuticals, Consumer Health, and Crop Science segments. The Pharmaceuticals segment provides prescription products primarily for cardiology and women's health care; specialty therapeutics in the areas of oncology, hematology, and ophthalmology; and diagnostic imaging equipment and contrast agents, as well as cell and gene therapy. The Consumer Health segment offers nonprescription over-the-counter medicines for self-medication and self-care; nutritional supplements; allergy, cough, and cold; dermatology; pain and cardiovascular risk prevention; and digestive health products. The Crop Science segment offers chemical and biological crop protection products, improved plant traits, seeds, digital solutions, and pest and weed management products, as well as customer services for agriculture. It also engages in the breeding, propagation, and production/processing of seeds, including seed dressing. The company distributes its products through wholesalers, pharmacies and pharmacy chains, supermarkets, online and other retailers, and hospitals, as well as directly to farmers. Bayer Aktiengesellschaft was founded in 1863 and is based in Leverkusen, Germany.
Source: TradingView
The charts and visual representations are sourced from TradingView through embedded widgets. For any issues with chart display, please visit the TradingView website
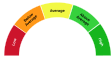
A unique technical analysis driven score developed by Kalkine showing momentum in stock prices based on select technical indicators identified.
Bayer AG is a global life sciences company operating pharmaceuticals, consumer health and crop science businesses, developing prescription medicines, over-the-counter products and agricultural inputs for farmers and healthcare providers. Its long-term growth could be supported by new drug launches, adoption of crop‑technology and precision agriculture, and portfolio simplification and deleveraging efforts, which may appeal to investors seeking diversified exposure to healthcare and agriculture.

Note: The summary and risk score provided above is created by AI and should not be construed as a recommendation of Kalkine.


| Breakdown | 2025-12-31 | 2024-12-31 | 2023-12-31 | 2022-12-31 | 2021-12-31 |
|---|---|---|---|---|---|
| Type | yearly | yearly | yearly | yearly | yearly |
| Date | 2025-12-31 | 2024-12-31 | 2023-12-31 | 2022-12-31 | 2021-12-31 |
| Income before tax | -3129.00M | -2334.00M | -1621.00M | 4670.00M | 2046.00M |
| Minority interest | -25.00M | -6.00M | 1.00M | -16.00M | -22.00M |
| Net income | -3620.00M | -2552.00M | -2941.00M | 4150.00M | 1000.00M |
| Selling general administrative | 14709.00M | 2574.00M | 2453.00M | 2838.00M | 2962.00M |
| Selling and marketing expenses | - | 13364.00M | 12482.00M | 14084.00M | 12363.00M |
| Gross profit | 26778.00M | 25336.00M | 27888.00M | 30868.00M | 27265.00M |
| Reconciled depreciation | 2785.00M | 8783.00M | 10020.00M | 6503.00M | 3056.00M |
| Ebit | - | 24.00M | -5811.00M | 6264.00M | 6975.00M |
| Ebitda | - | 8807.00M | 4209.00M | 12767.00M | 10031.00M |
| Depreciation and amortization | - | 8783.00M | 10020.00M | 6503.00M | 3056.00M |
| Operating income | 6139.00M | 3327.00M | -150.00M | 6264.00M | 6975.00M |
| Other operating expenses | - | 43279.00M | 47637.00M | 43406.00M | 37172.00M |
| Interest expense | 2265.00M | 2358.00M | 2047.00M | 1857.00M | 1347.00M |
| Tax provision | 466.00M | 212.00M | 1321.00M | 504.00M | 1024.00M |
| Interest income | 471.00M | 521.00M | 484.00M | 379.00M | 346.00M |
| Net interest income | -1857.00M | -1897.00M | -1611.00M | -1823.00M | -945.00M |
| Income tax expense | - | 212.00M | 1321.00M | 504.00M | 1024.00M |
| Total revenue | 45575.00M | 46606.00M | 47637.00M | 50739.00M | 44081.00M |
| Total operating expenses | 39436.00M | 22009.00M | 27888.00M | 23535.00M | 20356.00M |
| Cost of revenue | 18797.00M | 21270.00M | 19749.00M | 19871.00M | 16816.00M |
| Total other income expense net | - | -5661.00M | -1471.00M | -1594.00M | -4929.00M |
| Net income from continuing ops | -3595.00M | -2546.00M | -2942.00M | 4166.00M | 1022.00M |
| Net income applicable to common shares | - | - | - | 4150.00M | 1000.00M |
| Breakdown | 2025-12-31 | 2024-12-31 | 2023-12-31 | 2022-12-31 | 2021-12-31 |
|---|---|---|---|---|---|
| Type | yearly | yearly | yearly | yearly | yearly |
| Date | 2025-12-31 | 2024-12-31 | 2023-12-31 | 2022-12-31 | 2021-12-31 |
| Total assets | 104541.00M | 110850.00M | 116259.00M | 124877.00M | 120241.00M |
| Intangible assets | 20622.00M | 22112.00M | 19822.00M | 24183.00M | 26258.00M |
| Other current assets | - | 3059.00M | 3692.00M | 521.00M | 545.00M |
| Total liab | 78478.00M | 78805.00M | 83181.00M | 85951.00M | 87073.00M |
| Total stockholder equity | 26063.00M | 31908.00M | 32927.00M | 38773.00M | 33020.00M |
| Deferred long term liab | - | - | 3558.00M | 3797.00M | 4312.00M |
| Other current liab | 1180.00M | 15134.00M | 16678.00M | 7948.00M | 5245.00M |
| Common stock | - | 2515.00M | 2515.00M | 2515.00M | 2515.00M |
| Capital stock | 2515.00M | 2515.00M | 2515.00M | 2515.00M | 2515.00M |
| Retained earnings | - | - | 12175.00M | 17233.00M | 13345.00M |
| Other liab | - | - | 15548.00M | 17076.00M | 21189.00M |
| Good will | 28061.00M | 30016.00M | 32299.00M | 39648.00M | 40106.00M |
| Other assets | - | - | -7551.00M | 10481.00M | 10299.00M |
| Cash | 6671.00M | 6191.00M | 5907.00M | 5171.00M | 4564.00M |
| Total current liabilities | 32585.00M | 28952.00M | 29457.00M | 35084.00M | 29403.00M |
| Current deferred revenue | - | - | 2126.00M | 12052.00M | 14313.00M |
| Net debt | 28496.00M | 34506.00M | 36967.00M | 36149.00M | 34967.00M |
| Short term debt | - | 5206.00M | 4704.00M | 7539.00M | 3053.00M |
| Short long term debt | 4388.00M | 4897.00M | 4410.00M | 7257.00M | 2817.00M |
| Short long term debt total | - | 40697.00M | 42874.00M | 41320.00M | 39531.00M |
| Other stockholder equity | - | 29393.00M | 12175.00M | 36258.00M | 30505.00M |
| Property plant equipment | - | - | 13321.00M | 13674.00M | 12688.00M |
| Total current assets | 32911.00M | 34444.00M | 37556.00M | 37760.00M | 32578.00M |
| Net tangible assets | - | - | -19194.00M | -21294.00M | -29044.00M |
| Short term investments | 1185.00M | 1896.00M | 755.00M | 4982.00M | 3175.00M |
| Net receivables | 9077.00M | 9895.00M | 9348.00M | 10312.00M | 12980.00M |
| Long term debt | 30779.00M | 34552.00M | 37226.00M | 32829.00M | 35549.00M |
| Inventory | 12335.00M | 13403.00M | 13929.00M | 13595.00M | 11270.00M |
| Accounts payable | 7081.00M | 7518.00M | 7456.00M | 7545.00M | 6792.00M |
| Accumulated other comprehensive income | - | - | 18237.00M | - | - |
| Non currrent assets other | - | 3532.00M | 2650.00M | 6094.00M | 4594.00M |
| Non current assets total | 71630.00M | 76406.00M | 78703.00M | 87117.00M | 87663.00M |
| Capital lease obligations | 1286.00M | 1248.00M | 1238.00M | 1234.00M | 1165.00M |
| Breakdown | 2025-12-31 | 2024-12-31 | 2023-12-31 | 2022-12-31 | 2021-12-31 |
|---|---|---|---|---|---|
| Type | yearly | yearly | yearly | yearly | yearly |
| Date | 2025-12-31 | 2024-12-31 | 2023-12-31 | 2022-12-31 | 2021-12-31 |
| Investments | 661.00M | 164.00M | -3517.00M | -2381.00M | 4302.00M |
| Change to liabilities | - | - | - | 612.00M | 854.00M |
| Total cashflows from investing activities | - | - | - | -2381.00M | 855.00M |
| Net borrowings | -2045.00M | -5018.00M | 3253.00M | -974.00M | -2452.00M |
| Total cash from financing activities | - | -7178.00M | -679.00M | -4220.00M | -5645.00M |
| Change to operating activities | - | - | - | -1407.00M | 436.00M |
| Net income | -3620.00M | -2546.00M | -2941.00M | 4166.00M | 1022.00M |
| Change in cash | 776.00M | 284.00M | 736.00M | 607.00M | 373.00M |
| Begin period cash flow | 6191.00M | 5907.00M | 5171.00M | 4564.00M | 4191.00M |
| End period cash flow | 6671.00M | 6191.00M | 5907.00M | 5171.00M | 4564.00M |
| Total cash from operating activities | 5930.00M | 7368.00M | 5117.00M | 7093.00M | 5089.00M |
| Issuance of capital stock | - | 0.00M | 23.00M | - | - |
| Depreciation | 2785.00M | 8783.00M | 3933.00M | 6503.00M | 3056.00M |
| Other cashflows from investing activities | - | 784.00M | -464.00M | 218.00M | 137.00M |
| Dividends paid | -127.00M | 131.00M | 2379.00M | -1985.00M | -1993.00M |
| Change to inventory | 475.00M | 521.00M | -430.00M | -2170.00M | -173.00M |
| Change to account receivables | - | 197.00M | 689.00M | 269.00M | -61.00M |
| Sale purchase of stock | -14.00M | -16.00M | -24.00M | - | - |
| Other cashflows from financing activities | - | -2013.00M | -1552.00M | 5370.00M | 5392.00M |
| Change to netincome | - | - | - | 1690.00M | 1424.00M |
| Capital expenditures | 2487.00M | 2778.00M | 2751.00M | 2949.00M | 2611.00M |
| Change in working capital | 5934.00M | 85.00M | -4065.00M | -2696.00M | 1056.00M |
| Stock based compensation | - | - | 153.00M | - | - |
| Other non cash items | 1857.00M | 1046.00M | 8190.00M | -880.00M | -45.00M |
| Free cash flow | 3443.00M | 4590.00M | 2366.00M | 4144.00M | 2478.00M |
Sector: Healthcare Industry: Drug Manufacturers - General
|
Stock Name
|
Change
(USD) |
Price
(USD) |
Trailing
PE (x) |
Forward
PE (x) |
Price Sales
TTM (x) |
Price to Book Value (x)
|
Enterprise Value
to Revenue (x) |
Enterprise Value
to EBITDA (x) |
|---|---|---|---|---|---|---|---|---|
| BAYRY Bayer AG PK |
-0.31 1.95% |
15.61 | - | 9.06 | 1.01 | 1.50 | 1.52 | 36.04 |
| LLY Eli Lilly and Company |
5.20 0.36% |
1442.49 | 38.16 | 24.15 | 12.72 | 29.95 | 13.31 | 25.43 |
| JNJ Johnson & Johnson |
3.95 1.41% |
284.36 | 30.96 | 20.79 | 6.58 | 7.55 | 6.84 | 19.73 |
| ABBV AbbVie Inc |
1.13 0.38% |
296.11 | 74.10 | 16.21 | 7.22 | 50.46 | 8.18 | 27.04 |
| RHHVF Roche Holding AG Participation |
1.60 0.33% |
486.40 | 24.16 | 16.53 | 5.71 | 8.88 | 4.94 | 14.76 |
Bayer Aktiengesellschaft operates as a life science company in Europe, the Middle East, Africa, Germany, Switzerland, North America, the United States, the Asia Pacific, China, Latin America, and Brazil. It operates through Pharmaceuticals, Consumer Health, and Crop Science segments. The Pharmaceuticals segment provides prescription products primarily for cardiology and women's health care; specialty therapeutics in the areas of oncology, hematology, and ophthalmology; and diagnostic imaging equipment and contrast agents, as well as cell and gene therapy. The Consumer Health segment offers nonprescription over-the-counter medicines for self-medication and self-care; nutritional supplements; allergy, cough, and cold; dermatology; pain and cardiovascular risk prevention; and digestive health products. The Crop Science segment offers chemical and biological crop protection products, improved plant traits, seeds, digital solutions, and pest and weed management products, as well as customer services for agriculture. It also engages in the breeding, propagation, and production/processing of seeds, including seed dressing. The company distributes its products through wholesalers, pharmacies and pharmacy chains, supermarkets, online and other retailers, and hospitals, as well as directly to farmers. Bayer Aktiengesellschaft was founded in 1863 and is based in Leverkusen, Germany.
| Name | Title | Year Born |
|---|---|---|
| Mr. Werner Baumann | Chairman of Management Board, CEO & Chief Sustainability Officer | 1962 |
| Mr. Wolfgang U. Nickl | CFO & Member of Management Board | 1969 |
| Mr. Heiko W. J. Schipper | Member of Management Board & Pres of the Consumer Health Division | 1969 |
| Mr. Stefan Oelrich | Head of the Pharmaceuticals Division & Member of the Board of Management | 1968 |
| Ms. Sarena S. Lin | Chief Transformation & Talent Officer, Labor Director and Member of Management Board | 1971 |
| Mr. Rodrigo Santos | Member of Management Board & Pres of the Crop Science Division | 1973 |
| Mr. Bernd-Peter Bier | Head of Accounting and Head of Taxes | 1967 |
| Mr. Oliver Maier | Head of Investor Relations | NA |
| Dr. Gabriel Harnier | Head of Law, Patents & Compliance | 1971 |
| Mr. Michael Preuss | Head of Communications, Gov. Relations and Corp. Brand | NA |
Disclaimer - (*)This information, including any data, is sourced from Unicorn Data Services SAS, trading as EOD Historical Data (“EODHD”) on an ‘as is’ basis, using their API. We cannot guarantee the completeness or validity of the information and data provided on this page, as well as via the API. In some cases, the data may include analyst ratings or recommendations sourced through the EODHD API, which are intended solely for general information purposes.
This information does not consider your personal objectives, financial situation, or needs. Kalkine is not liable for any errors or omissions in the information provided or for any actions taken in reliance on it. You should seek advice from a financial adviser, stockbroker or other professional adviser (including taxation and legal advice) as necessary before acting on this information.

Download a free report with stock ideas and industry insights for general information.
Download Free Report Now →


Basic Materials
 -1.40%
Communication Services
-0.45%

Consumer Cyclical
-0.55%

Consumer Defensive
-0.01%

Energy
-0.01%

Financial Services
-0.40%
Financials
-0.15%

Healthcare
-1.15%

Industrials
-0.46%

Real Estate
-0.29%

Technology
-1.22%

Utilities
-0.10%
Note: Daily price change (%) by sector excluding stocks with +/-90% daily price change. Companies above $500 million market capitalization are considered.
 Portfolio
 Watchlist


 +0.55%
 Please wait processing your request...