 CA
 NZ
 UK
 AU
 IND

 US


…
Elite Pharmaceuticals, Inc., a specialty pharmaceutical company, engages in the development, manufacture, and sale of oral, controlled-release products, and generic pharmaceuticals. It owns, licenses, manufactures, and sales of generic, oral dose pharmaceuticals products, such as Phentermine HCl 37.5mg tablets, and 15mg and 30mg capsules to treat bariatrics under Adipex-P brand; Phendimetrazine Tartrate 35mg tablets for bariatrics under the Bontril brand; Naltrexone HCl 50mg tablets for the treatment of pains under the Revia brand; and Isradipine 2.5mg and 5mg capsules for cardiovascular diseases. It also provides Trimipramine Maleate Immediate Release antidepressant capsules under the Surmontil brand; Dextroamphetamine Saccharate, Amphetamine Aspartate, Dextroamphetamine Sulfate, and Amphetamine Sulfate Immediate Release tablets under the Adderall brand; Dextroamphetamine Saccharate, Amphetamine Aspartate, Dextroamphetamine Sulfate, Amphetamine Sulfate Extended Release capsules under the Adderall XR brand for central nervous system diseases; Dantrolene Sodium capsules for muscle relaxant under the Dantrium brand; Methotrexate Sodium 2.5mg tablets for the treatment of Antimetabolite under the Otrexup PF brand; Loxapine Succinate capsules for treating antipsychotic under the Loxapine brand; Acetaminophen and Codeine Phosphate for the management of mild to moderate pain; Acetaminophen and Hydrocodone Bitartrate capsules for the treatment of pain under the Norco brand; Lisdexamfetamine Dimesylate to treat ADHD under the Vyvanse brand; Oxycodone Hydrochloride and Acetaminophen tablets to treat pain under the Percocet brand name; and Methadone Hydrochloride tablets for the treatment of pain under the Dolophine brand. In addition, it manufactures controlled-release products on a contract basis for third parties in the areas of allergy, bariatric, attention deficit, and infection. The company was incorporated in 1997 and is headquartered in Northvale, New Jersey.
Source: TradingView
The charts and visual representations are sourced from TradingView through embedded widgets. For any issues with chart display, please visit the TradingView website
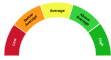
A unique technical analysis driven score developed by Kalkine showing momentum in stock prices based on select technical indicators identified.
Public disclosures for Elite Pharma Inc (OTCQB: ELTP) are limited, and the company's core business and products are not clearly documented in available filings. Because long-term growth drivers are not disclosed, investors should monitor regulatory progress, commercialization and partnership updates if released. The company could attract investors seeking early-stage pharmaceutical exposure, but that possibility is speculative given the information gap.
Material risks include scant disclosure and low liquidity typical of OTCQB listings, together with execution and regulatory risk common to small pharmaceutical companies.

Note: The summary and risk score provided above is created by AI and should not be construed as a recommendation of Kalkine.


| Breakdown | 2026-03-31 | 2025-03-31 | 2024-03-31 | 2023-03-31 | 2022-03-31 |
|---|---|---|---|---|---|
| Type | yearly | yearly | yearly | yearly | yearly |
| Date | 2026-03-31 | 2025-03-31 | 2024-03-31 | 2023-03-31 | 2022-03-31 |
| Income before tax | 56.81M | -0.05M | 0.46M | 3985.87M | 6.30M |
| Net income | 44.87M | -4.31M | 20.11M | 4409.90M | 8.90M |
| Selling general administrative | 17.77M | 9.23M | 7.31M | 5122.27M | 4.48M |
| Gross profit | 75.02M | 40.09M | 26.36M | 16594.02M | 14.80M |
| Reconciled depreciation | 2.02M | 2.12M | 1.52M | 1.34M | 1.43M |
| Ebit | - | - | - | 2025.11M | 5.07M |
| Ebitda | - | - | - | 3288.56M | 6.51M |
| Depreciation and amortization | - | - | - | 1263.45M | 1.43M |
| Operating income | 49.96M | 21.20M | 10.79M | 2025.11M | 5.07M |
| Other operating expenses | - | - | - | 30479.11M | 27.19M |
| Interest expense | 0.40M | 0.77M | 0.59M | 1112.71M | 0.19M |
| Tax provision | 11.94M | 4.26M | -19.65M | 0.42M | -1.74M |
| Interest income | 0.21M | 0.02M | 0.02M | 0.01M | 0.00M |
| Net interest income | -0.19M | -0.75M | -0.57M | -1.11M | -0.19M |
| Income tax expense | - | - | - | -424.03M | -1.74M |
| Total revenue | 148.87M | 84.04M | 56.63M | 34155.11M | 32.26M |
| Total operating expenses | 98.91M | 62.84M | 45.84M | 12918.02M | 9.72M |
| Cost of revenue | 73.85M | 43.96M | 30.27M | 17561.09M | 17.47M |
| Total other income expense net | 7.04M | -20.50M | -9.76M | 1960.76M | 1.23M |
| Net income from continuing ops | 44.87M | -4.31M | 20.11M | 3.56M | 8.90M |
| Net income applicable to common shares | - | - | - | - | 8.90M |
| Breakdown | 2026-03-31 | 2025-03-31 | 2024-03-31 | 2023-03-31 | 2022-03-31 |
|---|---|---|---|---|---|
| Type | yearly | yearly | yearly | yearly | yearly |
| Date | 2026-03-31 | 2025-03-31 | 2024-03-31 | 2023-03-31 | 2022-03-31 |
| Total assets | 138.29M | 96.39M | 83.65M | 40.90M | 35.15M |
| Intangible assets | 4.79M | 5.64M | 6.34M | 6.34M | 6.63M |
| Other current assets | 1.33M | 0.98M | 0.52M | 1.03M | 0.53M |
| Total liab | 39.41M | 42.87M | 26.07M | 11.94M | 9.93M |
| Total stockholder equity | 98.88M | 53.52M | 57.58M | 28.96M | 25.22M |
| Deferred long term liab | - | - | - | - | 6.17M |
| Other current liab | - | - | - | 5.05M | 4.69M |
| Common stock | - | - | - | 1.01M | 1.01M |
| Capital stock | 1.08M | 1.07M | 1.07M | 1.01M | 1.01M |
| Retained earnings | -75.83M | -120.70M | -116.39M | -136.50M | -140.06M |
| Other liab | - | - | - | - | 1.01M |
| Other assets | - | - | - | - | 8.84M |
| Cash | 29.80M | 11.32M | 7.11M | 7.83M | 8.54M |
| Total current liabilities | 17.39M | 11.84M | 13.05M | 7.83M | 6.69M |
| Current deferred revenue | - | - | - | 0.01M | 0.01M |
| Net debt | - | - | 0.47M | -3.94M | -5.75M |
| Short term debt | - | - | - | 0.33M | 0.56M |
| Short long term debt | 0.23M | 4.25M | 4.30M | 0.31M | 0.35M |
| Short long term debt total | - | - | - | 3.89M | 2.78M |
| Other stockholder equity | - | - | - | 164.44M | 164.27M |
| Property plant equipment | - | - | - | - | 6.98M |
| Total current assets | 112.11M | 57.74M | 40.01M | 21.51M | 18.86M |
| Net tangible assets | - | - | - | - | 24.76M |
| Net receivables | 59.72M | 29.21M | 19.45M | 3.09M | 3.06M |
| Long term debt | 2.80M | 3.03M | 3.28M | 3.56M | 1.39M |
| Inventory | 21.26M | 16.24M | 12.93M | 9.55M | 6.74M |
| Accounts payable | 6.05M | 2.96M | 2.71M | 2.45M | 1.43M |
| Non currrent assets other | 0.47M | 0.45M | 0.43M | 0.41M | 0.50M |
| Non current assets total | 26.18M | 38.65M | 43.64M | 19.39M | 16.29M |
| Capital lease obligations | 2.78M | 3.64M | 4.16M | 0.01M | 1.04M |
| Breakdown | 2026-03-31 | 2025-03-31 | 2024-03-31 | 2023-03-31 | 2022-03-31 |
|---|---|---|---|---|---|
| Type | yearly | yearly | yearly | yearly | yearly |
| Date | 2026-03-31 | 2025-03-31 | 2024-03-31 | 2023-03-31 | 2022-03-31 |
| Investments | - | -2.40M | -0.81M | -5.74M | -0.50M |
| Change to liabilities | - | - | - | - | 0.30M |
| Total cashflows from investing activities | - | - | - | - | -0.50M |
| Net borrowings | -4.64M | -0.85M | 3.34M | - | -0.67M |
| Total cash from financing activities | -4.32M | -0.83M | 3.34M | 1.70M | -0.67M |
| Change to operating activities | - | - | - | - | -0.02M |
| Net income | 44.87M | -4.31M | 20.11M | 3.56M | 8.90M |
| Change in cash | 18.50M | 4.23M | -0.71M | -0.70M | 5.34M |
| Begin period cash flow | 11.77M | 7.54M | 8.24M | 8.94M | 3.60M |
| End period cash flow | 30.27M | 11.77M | 7.54M | 8.24M | 8.94M |
| Total cash from operating activities | 23.75M | 7.46M | -3.24M | 3.34M | 6.51M |
| Issuance of capital stock | - | - | - | - | 0.00M |
| Depreciation | 2.02M | 2.12M | 1.52M | 1.34M | 1.43M |
| Change to inventory | -5.02M | -3.31M | -3.38M | -2.81M | -1.73M |
| Change to account receivables | -31.56M | -9.90M | -16.60M | -0.04M | 0.44M |
| Other cashflows from financing activities | - | - | - | -24.89M | -14.35M |
| Change to netincome | - | - | - | - | -2.81M |
| Capital expenditures | 0.93M | 2.53M | 0.81M | 5.74M | 0.50M |
| Change in working capital | -27.92M | -15.17M | -11.89M | -2.03M | -1.01M |
| Stock based compensation | 0.18M | 0.23M | 8.51M | 0.58M | 0.78M |
| Other non cash items | 0.01M | 0.01M | -7.51M | -1509.74M | -1.42M |
| Free cash flow | 22.82M | 4.93M | -4.04M | -2.40M | 6.01M |
Sector: Healthcare Industry: Drug Manufacturers - Specialty & Generic
|
Stock Name
|
Change
(USD) |
Price
(USD) |
Trailing
PE (x) |
Forward
PE (x) |
Price Sales
TTM (x) |
Price to Book Value (x)
|
Enterprise Value
to Revenue (x) |
Enterprise Value
to EBITDA (x) |
|---|---|---|---|---|---|---|---|---|
| ELTP Elite Pharma Inc |
-0.00 0.42% |
0.24 | 5.00 | - | 1.91 | 2.67 | 1.75 | 3.66 |
| MKKGY Merck KGaA ADR |
-0.22 0.66% |
33.17 | 21.25 | 14.93 | 3.10 | 2.14 | 3.60 | 12.98 |
| MKGAF MERCK Kommanditgesellschaft auf Aktien |
-2.76 1.62% |
167.12 | 24.86 | 15.11 | 3.13 | 1.98 | 3.08 | 18.89 |
| TAK Takeda Pharmaceutical Co Ltd ADR |
-0.17 0.80% |
21.02 | - | 10.96 | 0.01 | 1.20 | 2.94 | 23.11 |
| TKPHF Takeda Pharmaceutical Co. Ltd. |
- -% |
41.85 | - | 10.66 | 0.01 | 1.16 | 2.94 | 23.11 |
Elite Pharmaceuticals, Inc., a specialty pharmaceutical company, engages in the development, manufacture, and sale of oral, controlled-release products, and generic pharmaceuticals. It owns, licenses, manufactures, and sales of generic, oral dose pharmaceuticals products, such as Phentermine HCl 37.5mg tablets, and 15mg and 30mg capsules to treat bariatrics under Adipex-P brand; Phendimetrazine Tartrate 35mg tablets for bariatrics under the Bontril brand; Naltrexone HCl 50mg tablets for the treatment of pains under the Revia brand; and Isradipine 2.5mg and 5mg capsules for cardiovascular diseases. It also provides Trimipramine Maleate Immediate Release antidepressant capsules under the Surmontil brand; Dextroamphetamine Saccharate, Amphetamine Aspartate, Dextroamphetamine Sulfate, and Amphetamine Sulfate Immediate Release tablets under the Adderall brand; Dextroamphetamine Saccharate, Amphetamine Aspartate, Dextroamphetamine Sulfate, Amphetamine Sulfate Extended Release capsules under the Adderall XR brand for central nervous system diseases; Dantrolene Sodium capsules for muscle relaxant under the Dantrium brand; Methotrexate Sodium 2.5mg tablets for the treatment of Antimetabolite under the Otrexup PF brand; Loxapine Succinate capsules for treating antipsychotic under the Loxapine brand; Acetaminophen and Codeine Phosphate for the management of mild to moderate pain; Acetaminophen and Hydrocodone Bitartrate capsules for the treatment of pain under the Norco brand; Lisdexamfetamine Dimesylate to treat ADHD under the Vyvanse brand; Oxycodone Hydrochloride and Acetaminophen tablets to treat pain under the Percocet brand name; and Methadone Hydrochloride tablets for the treatment of pain under the Dolophine brand. In addition, it manufactures controlled-release products on a contract basis for third parties in the areas of allergy, bariatric, attention deficit, and infection. The company was incorporated in 1997 and is headquartered in Northvale, New Jersey.
| Name | Title | Year Born |
|---|---|---|
| Mr. Nasrat Hakim | Chairman, CEO & Pres | 1961 |
| Mr. Douglas Plassche | Exec. VP of Operations | 1964 |
| Mr. Robert Chen | CFO, Sec. & Treasurer | 1960 |
| Ms. Dianne Will | VP of Investor Relations & Corp. Affairs | NA |
| Dr. George Kenneth Smith J.D., M.B.A., Ph.D. | VP of Legal | NA |
| Dr. Sophy Abraham | Head of Regulatory Affairs | NA |
| Mr. Kirko Kirkov | Chief Commercial Officer | NA |
| Mr. Nasrat Hakim | Chairman, CEO & President | 1961 |
| Mr. Carter J. Ward CPA, CSCP | CFO, Secretary & Treasurer | 1964 |
| Mr. Douglas Plassche | Executive Vice President of Operations | 1964 |
Disclaimer - (*)This information, including any data, is sourced from Unicorn Data Services SAS, trading as EOD Historical Data (“EODHD”) on an ‘as is’ basis, using their API. We cannot guarantee the completeness or validity of the information and data provided on this page, as well as via the API. In some cases, the data may include analyst ratings or recommendations sourced through the EODHD API, which are intended solely for general information purposes.
This information does not consider your personal objectives, financial situation, or needs. Kalkine is not liable for any errors or omissions in the information provided or for any actions taken in reliance on it. You should seek advice from a financial adviser, stockbroker or other professional adviser (including taxation and legal advice) as necessary before acting on this information.

Download a free report with stock ideas and industry insights for general information.
Download Free Report Now →


Basic Materials
 +0.61%
Communication Services
 -0.21%

Consumer Cyclical
-0.26%

Consumer Defensive
-0.37%

Energy
+0.23%

Financial Services
-0.43%
Financials
+0.39%

Healthcare
+0.88%

Industrials
+0.36%

Real Estate
-0.51%

Technology
+1.35%

Utilities
+0.19%
Note: Daily price change (%) by sector excluding stocks with +/-90% daily price change. Companies above $500 million market capitalization are considered.
 Portfolio
 Watchlist


 Please wait processing your request...