 CA
 NZ
 UK
 AU
 IND

 US


…
Jardine Cycle & Carriage Limited, an investment holding company, provides the financial services, heavy equipment, mining, construction and energy, agribusiness, infrastructure and logistics, information technology, and property businesses in Indonesia, Singapore, and Malaysia. It manufactures, assembles, distributes, and retails motor vehicles, motorcycles and scooters; and provides aftersales services; manufactures and distributes automotive components. The company offers financial services, such as consumer finance for motorcycles and vehicles, anautomotive and heavy equipment financing, as well as insurance, fintech services, such as AstraPay, and digital banking services. It also manufactures, assembles, distributes, and owns dealership networks for Toyota, Daihatsu, Isuzu, and UD Trucks, as well as Honda motorcycles; and manufactures and retails BMW vehicles, and owns the Lexus cars dealership. In addition, the company distributes Komatsu, UD Trucks, SCANIA, Bomag, and Tadano heavy equipment; and invest in gold and nickel non-coal mineral mining sector and renewable energy, as well as owns mines and thermal power assets. Further, it plants, harvests, and processes palm oil; develops and manages toll roads; provides printing and digital services solutions. The company also distributes FUJIFILM business products, as well as developing office buildings and residential projects. It is involved in renting and leasing private cars without operator; coal mining contractor; provision of document, information and communication technology solutions. The company was formerly known as Cycle & Carriage Ltd. and changed its name to Jardine Cycle & Carriage Limited in 2004. Jardine Cycle & Carriage Limited was founded in 1899 and is based in Singapore. Jardine Cycle & Carriage Limited operates as a subsidiary of Jardine Strategic Singapore Pte Ltd.
Source: TradingView
The charts and visual representations are sourced from TradingView through embedded widgets. For any issues with chart display, please visit the TradingView website
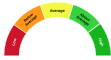
A unique technical analysis driven score developed by Kalkine showing momentum in stock prices based on select technical indicators identified.
Jardine Cycle & Carriage is a Singapore-listed investment holding company with a major equity exposure to Indonesia's Astra and operating interests in automotive, heavy equipment and financial services across Southeast Asia. Long-term growth may be driven by rising vehicle ownership, aftermarket and financial-services penetration, and steady cash flow from established subsidiaries; investors may find it attractive for diversified, cash-generative assets and regional consumer exposure.
Principal risks include concentration of exposure to Indonesia, cyclicality in the automotive sector, currency and regulatory risk, and sensitivity of earnings and dividends to macroeconomic swings.

Note: The summary and risk score provided above is created by AI and should not be construed as a recommendation of Kalkine.


| Breakdown | 2025-12-31 | 2024-12-31 | 2023-12-31 | 2022-12-31 | 2021-12-31 |
|---|---|---|---|---|---|
| Type | yearly | yearly | yearly | yearly | yearly |
| Date | 2025-12-31 | 2024-12-31 | 2023-12-31 | 2022-12-31 | 2021-12-31 |
| Income before tax | 3031.63M | 3218.30M | 3714.50M | 3227.20M | 2233.60M |
| Minority interest | -1415.90M | -1604.90M | -1761.30M | -1716.10M | -1057.70M |
| Net income | 998.83M | 945.80M | 1215.40M | 739.80M | 660.60M |
| Selling general administrative | 1410.10M | 1356.40M | 1282.30M | 1178.60M | 1144.20M |
| Selling and marketing expenses | 827.50M | 823.60M | 861.70M | 890.40M | 867.80M |
| Gross profit | 4585.60M | 4867.70M | 5049.10M | 4908.40M | 3765.10M |
| Reconciled depreciation | 1157.90M | 1141.40M | 1037.00M | 1005.50M | 1063.80M |
| Ebit | 2328.61M | 3533.80M | 3104.20M | 2830.00M | 1821.40M |
| Ebitda | 3487.70M | 4675.20M | 3962.60M | 3835.50M | 2885.20M |
| Depreciation and amortization | 1159.10M | 1141.40M | 858.40M | 1005.50M | 1063.80M |
| Operating income | 2328.61M | 2607.20M | 3104.20M | 2710.00M | 1695.30M |
| Other operating expenses | 19051.58M | 19691.20M | 19130.30M | 19083.50M | 15992.70M |
| Interest expense | 276.39M | 315.50M | 256.30M | 178.20M | 178.40M |
| Tax provision | 614.80M | 667.60M | 737.80M | 771.30M | 515.30M |
| Interest income | 177.10M | 173.90M | 149.00M | 120.00M | 126.10M |
| Net interest income | -99.00M | -141.60M | -122.50M | -58.20M | -52.30M |
| Income tax expense | 615.44M | 667.60M | 737.80M | 771.30M | 515.30M |
| Total revenue | 21380.19M | 22298.40M | 22234.50M | 21793.50M | 17688.00M |
| Total operating expenses | 2143.10M | 2260.50M | 1944.90M | 2198.40M | 2069.80M |
| Cost of revenue | 16772.50M | 17430.70M | 17185.40M | 16885.10M | 13922.90M |
| Total other income expense net | 703.03M | 611.10M | 610.30M | 517.20M | 538.30M |
| Net income from continuing ops | 2413.70M | 2550.70M | 2976.70M | 2455.90M | 1718.30M |
| Net income applicable to common shares | - | - | - | 739.80M | 660.60M |
| Breakdown | 2025-12-31 | 2024-12-31 | 2023-12-31 | 2022-12-31 | 2021-12-31 |
|---|---|---|---|---|---|
| Type | yearly | yearly | yearly | yearly | yearly |
| Date | 2025-12-31 | 2024-12-31 | 2023-12-31 | 2022-12-31 | 2021-12-31 |
| Total assets | 33218.09M | 32352.80M | 32393.60M | 29303.20M | 29053.70M |
| Intangible assets | 1262.00M | 1297.40M | 1320.40M | 1307.30M | 1387.30M |
| Other current assets | -0.00M | 519.30M | 3775.30M | 716.50M | 2915.00M |
| Total liab | 14269.81M | 13934.20M | 14578.30M | 12853.70M | 12658.40M |
| Total stockholder equity | 8596.75M | 8291.30M | 8039.40M | 7139.80M | 7368.20M |
| Other current liab | 247.17M | 114.00M | 5340.10M | 248.20M | 4517.30M |
| Common stock | 1380.99M | 1381.00M | 1381.00M | 1381.00M | 1381.00M |
| Capital stock | 1381.00M | 1381.00M | 1381.00M | 1381.00M | 1381.00M |
| Retained earnings | - | 9074.20M | 8593.60M | 7815.60M | 7429.60M |
| Other liab | - | - | - | 1085.60M | 1140.80M |
| Good will | 429.10M | 440.10M | 394.80M | 368.10M | 388.60M |
| Other assets | - | - | - | 1661.30M | 1513.90M |
| Cash | 3269.28M | 3088.10M | 2782.50M | 4018.10M | 4588.80M |
| Total current liabilities | 9517.34M | 8525.90M | 9197.20M | 8572.60M | 7582.90M |
| Current deferred revenue | - | - | 212.70M | - | - |
| Net debt | 4165.67M | 4206.40M | 4783.20M | 2085.70M | 2088.40M |
| Short term debt | 4320.60M | 3165.90M | 3487.70M | 2908.30M | 2742.50M |
| Short long term debt | 4253.50M | 3091.70M | 3408.30M | 2840.30M | 2689.90M |
| Short long term debt total | 7434.95M | 7294.50M | 7565.70M | 6103.80M | 6677.20M |
| Other stockholder equity | 10027.14M | 6910.30M | -8593.60M | -31.50M | 5987.20M |
| Property plant equipment | - | - | - | 4890.30M | 5120.10M |
| Total current assets | 12440.92M | 11786.90M | 11564.10M | 12057.30M | 11813.50M |
| Net tangible assets | - | - | - | 5464.40M | 5592.30M |
| Short term investments | 374.20M | 50.00M | 55.00M | 18.20M | 45.60M |
| Net receivables | 6004.06M | 5688.30M | 1797.90M | 5490.60M | 2732.20M |
| Long term debt | 2919.70M | 3948.40M | 3899.30M | 3107.90M | 3870.30M |
| Inventory | 2793.38M | 2441.20M | 3153.40M | 2530.40M | 1531.90M |
| Accounts payable | 4949.57M | 5122.10M | 156.70M | 5135.90M | 84.10M |
| Accumulated other comprehensive income | -2811.38M | -2163.90M | -1935.20M | -2025.30M | -1442.40M |
| Non currrent assets other | - | 4219.00M | 4681.90M | 3515.60M | 3357.40M |
| Non current assets total | 20777.17M | 20565.90M | 20829.50M | 17172.10M | 17240.20M |
| Capital lease obligations | 261.80M | 254.40M | 258.10M | 155.60M | 117.00M |
| Breakdown | 2025-12-31 | 2024-12-31 | 2023-12-31 | 2022-12-31 | 2021-12-31 |
|---|---|---|---|---|---|
| Type | yearly | yearly | yearly | yearly | yearly |
| Date | 2025-12-31 | 2024-12-31 | 2023-12-31 | 2022-12-31 | 2021-12-31 |
| Investments | -115.40M | -1092.50M | -3038.90M | -1524.10M | -206.60M |
| Change to liabilities | - | - | - | 1192.50M | 979.90M |
| Total cashflows from investing activities | -1817.68M | -1092.50M | -3038.90M | -1524.10M | -688.50M |
| Net borrowings | 197.70M | -40.40M | 1356.80M | -412.00M | -640.40M |
| Total cash from financing activities | -1090.83M | -1529.30M | -723.90M | -1589.90M | -1229.80M |
| Change to operating activities | - | - | - | -627.40M | -394.20M |
| Net income | 998.83M | 3218.30M | 3714.50M | 3227.20M | 2233.60M |
| Change in cash | 181.18M | 305.60M | -1235.60M | -570.70M | 1091.20M |
| Begin period cash flow | 3088.10M | 2782.50M | 4018.10M | 4588.80M | 3497.60M |
| End period cash flow | 3269.28M | 3088.10M | 2782.50M | 4018.10M | 4588.80M |
| Total cash from operating activities | 3170.07M | 3043.30M | 2471.20M | 2850.50M | 3028.30M |
| Depreciation | 1159.10M | 1141.40M | 1037.00M | 1005.50M | 1063.80M |
| Other cashflows from investing activities | - | -20.40M | 149.30M | -23.80M | -13.30M |
| Dividends paid | 436.85M | 466.40M | 442.90M | 357.00M | 204.70M |
| Change to inventory | -34.14M | -98.10M | -595.70M | -887.50M | -319.80M |
| Change to account receivables | -623.64M | -726.20M | -674.70M | -937.50M | -416.90M |
| Other cashflows from financing activities | -851.88M | -1022.50M | -1637.80M | 2151.40M | 3787.00M |
| Change to netincome | - | - | - | 2411.00M | 1435.60M |
| Capital expenditures | 1045.88M | 1124.90M | 1564.80M | 909.30M | 512.70M |
| Change in working capital | -574.39M | -860.00M | -1309.90M | -1314.90M | -140.10M |
| Other non cash items | 1586.54M | -456.40M | -970.40M | -67.30M | -129.00M |
| Free cash flow | 2124.19M | 1918.40M | 906.40M | 1941.20M | 2515.60M |
Sector: Industrials Industry: Conglomerates
|
Stock Name
|
Change
(USD) |
Price
(USD) |
Trailing
PE (x) |
Forward
PE (x) |
Price Sales
TTM (x) |
Price to Book Value (x)
|
Enterprise Value
to Revenue (x) |
Enterprise Value
to EBITDA (x) |
|---|---|---|---|---|---|---|---|---|
| JCYGY Jardine Cycle & Carriage Ltd ADR |
- -% |
36.00 | 8.65 | 22.68 | 0.42 | 1.03 | 0.63 | 4.48 |
| MTSUY Mitsubishi Corporation |
-0.93 2.94% |
30.66 | 23.01 | 15.60 | 0.01 | 1.91 | 1.18 | 13.36 |
| MSBHF Mitsubishi Corp. |
-1.15 3.62% |
30.65 | 22.90 | 15.90 | 0.01 | 1.94 | 1.18 | 13.36 |
| ITOCF ITOCHU Corporation |
- -% |
14.26 | 18.13 | 16.50 | 0.01 | 2.45 | 1.37 | 11.52 |
| MITSY Mitsui & Company Ltd |
-23.60 3.96% |
573.10 | 17.30 | 15.77 | 0.01 | 1.62 | 1.30 | 11.28 |
Jardine Cycle & Carriage Limited, an investment holding company, provides the financial services, heavy equipment, mining, construction and energy, agribusiness, infrastructure and logistics, information technology, and property businesses in Indonesia, Singapore, and Malaysia. It manufactures, assembles, distributes, and retails motor vehicles, motorcycles and scooters; and provides aftersales services; manufactures and distributes automotive components. The company offers financial services, such as consumer finance for motorcycles and vehicles, anautomotive and heavy equipment financing, as well as insurance, fintech services, such as AstraPay, and digital banking services. It also manufactures, assembles, distributes, and owns dealership networks for Toyota, Daihatsu, Isuzu, and UD Trucks, as well as Honda motorcycles; and manufactures and retails BMW vehicles, and owns the Lexus cars dealership. In addition, the company distributes Komatsu, UD Trucks, SCANIA, Bomag, and Tadano heavy equipment; and invest in gold and nickel non-coal mineral mining sector and renewable energy, as well as owns mines and thermal power assets. Further, it plants, harvests, and processes palm oil; develops and manages toll roads; provides printing and digital services solutions. The company also distributes FUJIFILM business products, as well as developing office buildings and residential projects. It is involved in renting and leasing private cars without operator; coal mining contractor; provision of document, information and communication technology solutions. The company was formerly known as Cycle & Carriage Ltd. and changed its name to Jardine Cycle & Carriage Limited in 2004. Jardine Cycle & Carriage Limited was founded in 1899 and is based in Singapore. Jardine Cycle & Carriage Limited operates as a subsidiary of Jardine Strategic Singapore Pte Ltd.
| Name | Title | Year Born |
|---|---|---|
| Mr. Benjamin Herrenden Birks | Group MD & Director | 1973 |
| Mr. Eng Heong Tan | Group Gen. Counsel, Chief Sust. Officer, Director of Legal & Corp. Affairs and Company Sec. | 1961 |
| Mr. Jason Wen | Director of HR | NA |
| Mr. Stephen Patrick Gore | Group Director of Bus. Devel. & Director | 1972 |
| Mr. Kent Teo | Exec. Officer | 1985 |
| Ms. Hai Yeh Hsu | Exec. Director & Group Fin. Director | 1985 |
| Mr. Kim Teck Cheah | Managing Director of Bus. Devel. | 1952 |
| Mr. Lee Liang Whye | CEO & Executive Director | 1981 |
| Mr. Yang Yen Ng | Finance Director & Executive Director | 1979 |
| Mr. Jason Wen | Director of Human Resources | NA |
Disclaimer - (*)This information, including any data, is sourced from Unicorn Data Services SAS, trading as EOD Historical Data (“EODHD”) on an ‘as is’ basis, using their API. We cannot guarantee the completeness or validity of the information and data provided on this page, as well as via the API. In some cases, the data may include analyst ratings or recommendations sourced through the EODHD API, which are intended solely for general information purposes.
This information does not consider your personal objectives, financial situation, or needs. Kalkine is not liable for any errors or omissions in the information provided or for any actions taken in reliance on it. You should seek advice from a financial adviser, stockbroker or other professional adviser (including taxation and legal advice) as necessary before acting on this information.

Download a free report with stock ideas and industry insights for general information.
Download Free Report Now →


Basic Materials
 -1.14%
Communication Services
-1.25%

Consumer Cyclical
-1.10%

Consumer Defensive
-0.88%

Energy
-0.75%

Financial Services
-0.95%
Financials
-0.37%

Healthcare
-0.71%

Industrials
-0.76%

Real Estate
-0.66%

Technology
-1.57%

Utilities
-0.40%
Note: Daily price change (%) by sector excluding stocks with +/-90% daily price change. Companies above $500 million market capitalization are considered.
 Portfolio
 Watchlist


 +-%
 Please wait processing your request...