 CA
 NZ
 UK
 AU
 IND

 US


…
Leatt Corporation designs, develops, markets, and distributes personal protective equipment for participants of motor sports and leisure activities in South Africa and internationally. The company offers Leatt-Brace system, an injection molded neck protection system designed to prevent injuries to the cervical spine and neck. It also provides helmets for head and brain protection; and body armor products, including chest protectors, full upper body protectors, upper body protection vests, back protectors, knee braces, knee and elbow guards, off-road motorcycle boots, and mountain biking shoes. In addition, the company offers other products, parts, and accessories, such as goggles and hydrations bags, as well as apparel items that comprise suits, jackets, jerseys, pants, shorts, socks, gloves, sunglasses, and bicycle components; and aftermarket support products; toolbelt, duffel, gear, and helmet bags; backpacks, hats, and hydration kits; and casual clothing and caps. Further, it acts as the original equipment manufacturer for personal protective equipment sold by other brands. The company's products are used by riders of motorcycles, bicycles, snowmobiles, and ATVs. It sells its products to customers through a network of distributors and retailers; and directs end consumers through digital channels and online store at leatt.com. The company was formerly known as Treadzone, Inc. and changed its name to Leatt Corporation in May 2005. Leatt Corporation was founded in 2001 and is headquartered in Durbanville, South Africa.
Source: TradingView
The charts and visual representations are sourced from TradingView through embedded widgets. For any issues with chart display, please visit the TradingView website
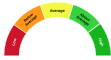
A unique technical analysis driven score developed by Kalkine showing momentum in stock prices based on select technical indicators identified.


| Breakdown | 2025-12-31 | 2024-12-31 | 2023-12-31 | 2022-12-31 | 2021-12-31 |
|---|---|---|---|---|---|
| Type | yearly | yearly | yearly | yearly | yearly |
| Date | 2025-12-31 | 2024-12-31 | 2023-12-31 | 2022-12-31 | 2021-12-31 |
| Income before tax | 4.41M | -2.70M | 1.38M | 13.00M | 16.62M |
| Net income | 3.26M | -2.20M | 0.80M | 9.96M | 12.57M |
| Selling general administrative | 19.40M | 17.34M | 14.79M | 14.60M | 11.13M |
| Gross profit | 27.22M | 17.71M | 19.81M | 31.13M | 31.45M |
| Reconciled depreciation | 1.33M | 1.23M | 1.17M | 1.10M | 1.03M |
| Ebit | - | - | - | 13.02M | 16.62M |
| Ebitda | - | - | - | 14.59M | 17.86M |
| Operating income | 4.18M | -3.06M | 1.41M | 13.49M | 16.62M |
| Other operating expenses | - | - | - | 0.24M | 1.65M |
| Interest expense | - | - | - | - | 0.00M |
| Tax provision | 1.14M | -0.50M | 0.58M | 3.04M | 4.04M |
| Net interest income | 0.40M | 0.28M | -0.04M | -0.01M | -0.00M |
| Non recurring | - | - | - | - | 0.22M |
| Income tax expense | - | - | - | 3.04M | 4.04M |
| Total revenue | 61.91M | 44.03M | 47.24M | 76.34M | 72.48M |
| Total operating expenses | 57.73M | 47.08M | 45.83M | 62.84M | 15.01M |
| Cost of revenue | 34.69M | 26.31M | 27.44M | 45.20M | 41.03M |
| Total other income expense net | -0.17M | 0.08M | 0.01M | -0.47M | -0.22M |
| Net income from continuing ops | 3.26M | -2.20M | 0.80M | 9.96M | 12.57M |
| Net income applicable to common shares | - | - | - | 9.96M | 12.57M |
| Breakdown | 2025-12-31 | 2024-12-31 | 2023-12-31 | 2022-12-31 | 2021-12-31 |
|---|---|---|---|---|---|
| Type | yearly | yearly | yearly | yearly | yearly |
| Date | 2025-12-31 | 2024-12-31 | 2023-12-31 | 2022-12-31 | 2021-12-31 |
| Total assets | 52.05M | 46.49M | 47.61M | 51.93M | 49.17M |
| Other current assets | 3.63M | 3.00M | 2.30M | 2.06M | 4.24M |
| Total liab | 9.81M | 8.22M | 7.33M | 12.23M | 19.47M |
| Total stockholder equity | 42.23M | 38.26M | 40.28M | 39.69M | 28.62M |
| Deferred long term liab | - | - | - | - | 0.55M |
| Other current liab | 0.01M | - | - | 3.38M | 0.32M |
| Common stock | - | - | - | 0.13M | 0.13M |
| Capital stock | 0.13M | 0.13M | 0.13M | 0.13M | 0.13M |
| Retained earnings | 31.86M | 28.60M | 30.80M | 30.00M | 20.04M |
| Other liab | - | - | - | 0.07M | 0.55M |
| Other assets | - | - | - | 0.04M | 0.03M |
| Cash | 12.99M | 12.37M | 11.35M | 7.10M | 5.02M |
| Total current liabilities | 9.78M | 7.92M | 6.75M | 11.21M | 18.73M |
| Short term debt | - | - | - | - | 1.06M |
| Short long term debt | 0.80M | 0.76M | 1.25M | 1.14M | 1.06M |
| Other stockholder equity | - | - | - | -1.08M | -0.78M |
| Property plant equipment | - | - | - | 4.20M | 3.13M |
| Total current assets | 47.60M | 41.17M | 42.30M | 47.69M | 44.61M |
| Net tangible assets | - | - | - | 39.69M | 29.69M |
| Short term investments | - | - | - | 0.00M | 0.06M |
| Net receivables | 7.90M | 6.41M | 6.97M | 12.84M | 14.27M |
| Long term debt | - | 0.00M | 0.03M | 0.14M | 0.19M |
| Inventory | 20.90M | 17.99M | 20.39M | 22.81M | 21.08M |
| Accounts payable | 8.60M | 6.91M | 5.20M | 6.01M | 17.36M |
| Common stock total equity | - | - | - | - | 0.13M |
| Preferred stock total equity | - | - | - | - | 0.00M |
| Retained earnings total equity | - | - | - | - | 20.04M |
| Non currrent assets other | - | - | - | - | 1.43M |
| Non current assets total | 4.44M | 5.32M | 5.30M | 4.24M | 4.55M |
| Capital lease obligations | 0.34M | 0.55M | 0.85M | 1.09M | 1.39M |
| Long term debt total | - | - | - | - | 0.19M |
| Breakdown | 2025-12-31 | 2024-12-31 | 2023-12-31 | 2022-12-31 | 2021-12-31 |
|---|---|---|---|---|---|
| Type | yearly | yearly | yearly | yearly | yearly |
| Date | 2025-12-31 | 2024-12-31 | 2023-12-31 | 2022-12-31 | 2021-12-31 |
| Investments | - | -1.23M | 0.00M | 0.06M | -0.00M |
| Change to liabilities | - | - | - | -8.61M | 7.69M |
| Total cashflows from investing activities | - | - | - | -1.04M | -1.14M |
| Net borrowings | 0.04M | -0.51M | -0.00M | 0.03M | 0.57M |
| Total cash from financing activities | -0.22M | -0.51M | -0.00M | 0.29M | 0.60M |
| Change to operating activities | - | - | - | 0.81M | -2.79M |
| Net income | 3.26M | -2.20M | 0.80M | 9.96M | 12.57M |
| Change in cash | 0.86M | 1.02M | 4.24M | 2.08M | 2.24M |
| Begin period cash flow | 12.37M | 11.35M | 7.10M | 5.02M | 2.97M |
| End period cash flow | 13.23M | 12.37M | 11.35M | 7.10M | 5.02M |
| Total cash from operating activities | 1.81M | 2.79M | 6.66M | 3.09M | 2.78M |
| Issuance of capital stock | - | - | 0.00M | 0.26M | 0.03M |
| Depreciation | 1.33M | 1.23M | 1.17M | 1.10M | 1.03M |
| Other cashflows from investing activities | - | - | - | - | 0.00M |
| Change to inventory | -2.87M | 2.10M | 2.29M | -1.71M | -11.41M |
| Change to account receivables | -1.14M | 1.00M | 5.61M | -0.63M | -5.68M |
| Sale purchase of stock | -0.26M | 0.00M | - | - | 0.03M |
| Change to netincome | - | - | - | 1.52M | 1.26M |
| Capital expenditures | 1.08M | 1.23M | 2.00M | 1.14M | 1.14M |
| Change receivables | - | - | - | - | -5.68M |
| Cash flows other operating | - | - | - | - | -2.68M |
| Exchange rate changes | - | - | - | - | -0.19M |
| Cash and cash equivalents changes | - | - | - | - | 2.06M |
| Change in working capital | -3.52M | 4.00M | 4.76M | -9.49M | -12.19M |
| Stock based compensation | 0.49M | 0.24M | 0.10M | 1.16M | 0.87M |
| Other non cash items | 0.08M | - | - | - | - |
| Free cash flow | 0.73M | 1.56M | 4.66M | 1.94M | 1.64M |
Sector: Consumer Cyclical Industry: Leisure
|
Stock Name
|
Change
(USD) |
Price
(USD) |
Trailing
PE (x) |
Forward
PE (x) |
Price Sales
TTM (x) |
Price to Book Value (x)
|
Enterprise Value
to Revenue (x) |
Enterprise Value
to EBITDA (x) |
|---|---|---|---|---|---|---|---|---|
| LEAT Leatt Corp |
0.19 1.72% |
11.23 | 20.70 | - | 1.11 | 1.63 | 0.82 | 8.49 |
| OLCLY Oriental Land Co Ltd ADR |
-0.02 0.08% |
24.16 | 41.39 | 43.67 | 0.05 | 4.46 | 6.91 | 20.36 |
| ANPDF ANTA Sports Products Ltd |
- -% |
10.27 | 15.57 | 14.95 | 0.39 | 3.13 | 2.49 | 6.99 |
| ANPDY ANTA Sports Products Ltd ADR |
0.08 0.03% |
261.90 | 15.60 | 15.06 | 0.38 | 3.15 | 2.49 | 6.99 |
| OLCLF Oriental Land Co. Ltd |
- -% |
22.99 | 37.74 | 39.22 | 0.04 | 4.01 | 6.91 | 20.36 |
Leatt Corporation designs, develops, markets, and distributes personal protective equipment for participants of motor sports and leisure activities in South Africa and internationally. The company offers Leatt-Brace system, an injection molded neck protection system designed to prevent injuries to the cervical spine and neck. It also provides helmets for head and brain protection; and body armor products, including chest protectors, full upper body protectors, upper body protection vests, back protectors, knee braces, knee and elbow guards, off-road motorcycle boots, and mountain biking shoes. In addition, the company offers other products, parts, and accessories, such as goggles and hydrations bags, as well as apparel items that comprise suits, jackets, jerseys, pants, shorts, socks, gloves, sunglasses, and bicycle components; and aftermarket support products; toolbelt, duffel, gear, and helmet bags; backpacks, hats, and hydration kits; and casual clothing and caps. Further, it acts as the original equipment manufacturer for personal protective equipment sold by other brands. The company's products are used by riders of motorcycles, bicycles, snowmobiles, and ATVs. It sells its products to customers through a network of distributors and retailers; and directs end consumers through digital channels and online store at leatt.com. The company was formerly known as Treadzone, Inc. and changed its name to Leatt Corporation in May 2005. Leatt Corporation was founded in 2001 and is headquartered in Durbanville, South Africa.
| Name | Title | Year Born |
|---|---|---|
| Dr. Christopher James Leatt ChB, MB | Founder, Chairman, Head of R&D and R&D Consultant | 1968 |
| Mr. Sean MacDonald CA (SA) | CEO, CFO, Pres & Director | 1977 |
| Mr. Michael Mason J.D. | Investor Relations | NA |
| Lara-Jane Pretorius | Chief Legal & Compliance Officer and Corp. Sec. | NA |
| Mr. Erik Olsson | International GM & Head of International Distribution | 1968 |
| Dr. Christopher James Leatt ChB, MB | Founder, Chairman and Research & Development Consultant | 1968 |
| Mr. Sean MacDonald C.A., CA (SA) | CEO, CFO, President & Director | 1977 |
| Lara-Jane Pretorius | Chief Legal & Compliance Officer and Corporate Secretary | NA |
Disclaimer - (*)This information, including any data, is sourced from Unicorn Data Services SAS, trading as EOD Historical Data (“EODHD”) on an ‘as is’ basis, using their API. We cannot guarantee the completeness or validity of the information and data provided on this page, as well as via the API. In some cases, the data may include analyst ratings or recommendations sourced through the EODHD API, which are intended solely for general information purposes.
This information does not consider your personal objectives, financial situation, or needs. Kalkine is not liable for any errors or omissions in the information provided or for any actions taken in reliance on it. You should seek advice from a financial adviser, stockbroker or other professional adviser (including taxation and legal advice) as necessary before acting on this information.

Download a free report with stock ideas and industry insights for general information.
Download Free Report Now →


Basic Materials
 -1.69%
Communication Services
 +0.09%

Consumer Cyclical
+0.66%

Consumer Defensive
+0.20%

Energy
-1.15%

Financial Services
-0.27%
Financials
-0.67%

Healthcare
+0.05%

Industrials
+0.05%

Real Estate
+0.22%

Technology
+0.51%

Utilities
+0.39%
Note: Daily price change (%) by sector excluding stocks with +/-90% daily price change. Companies above $500 million market capitalization are considered.
 Portfolio
 Watchlist


 Please wait processing your request...