 CA
 NZ
 UK
 AU
 IND

 US


…
Mobiquity Technologies, Inc., together with its subsidiaries, operates as an advertising technology, data compliance, and intelligence company in the United States. It provides advertising technology operating system platform comprising adserver, demand side platform, advertisement quality tools, analytics dashboard, avails engine, advertisement prediction and delivery tools, supply quality tools, private marketplace tools, audience and location targeting, wrap up reports, an advertisement software development kit, prebid adaptor, contextual targeting, identity graph capabilities, cookie syncing, and the updated version of a quality and security tools that blends artificial intelligence and machine learning-based optimization technology which automatically serves advertising and manages digital advertising inventory and campaigns. The company also offers data intelligence platform for that provides precise data and insights on consumer's real-world behavior and trends for use in marketing and research; and MobiExchange, a data-focused technology solution that enables users to rapidly build actionable data and insights for its own use, providing out-of-the box private labeling, flexible branding, content management, user management, user communications, subscriptions, payment, invoices, reporting, gateways to third party platforms, and help desk solutions. In addition, it provides content publisher platform, a single-vendor ad tech operating system with tools for consent management, audience building, a direct advertising interface, and inventory enhancement, that allows publishers to better monetize their opt-in user data and advertising inventory. The company was formerly known as Ace Marketing & Promotions, Inc. and changed its name to Mobiquity Technologies, Inc. in September 2013. Mobiquity Technologies, Inc. was incorporated in 1998 and is headquartered in Shoreham, New York.
Source: TradingView
The charts and visual representations are sourced from TradingView through embedded widgets. For any issues with chart display, please visit the TradingView website
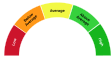
A unique technical analysis driven score developed by Kalkine showing momentum in stock prices based on select technical indicators identified.
Public disclosures for Mobiquity Technologies Inc (OTCQB: MOBQ) are limited; the company describes itself in regulatory filings as a development-stage technology business focused on digital payments and consumer fintech solutions. Long-term growth may depend on successful product commercialization, broader adoption of digital payment services, and securing financing or partnerships that could support scale, which may make the company of interest to investors seeking early-stage fintech exposure.
Key risks include sparse and inconsistent public reporting, limited operating history and OTC liquidity, significant execution and financing risk that could lead to dilution or failure to commercialize products, and regulatory uncertainty around payments and crypto-related activities.

Note: The summary and risk score provided above is created by AI and should not be construed as a recommendation of Kalkine.


| Breakdown | 2022-12-31 | 2021-12-31 | 2020-12-31 | 2019-12-31 | 2018-12-31 |
|---|---|---|---|---|---|
| Type | yearly | yearly | yearly | yearly | yearly |
| Date | 2022-12-31 | 2021-12-31 | 2020-12-31 | 2019-12-31 | 2018-12-31 |
| Income before tax | -8.06M | -34.95M | -15.03M | -43.75M | -58.51M |
| Minority interest | - | - | - | - | 0.66M |
| Net income | -8.63M | -35.77M | -15.74M | -44.09M | -58.51M |
| Selling general administrative | 9.21M | 13.11M | 9.20M | 15.88M | 17.26M |
| Selling and marketing expenses | - | 6.53M | - | - | - |
| Gross profit | 1.87M | 0.72M | 1.82M | 2.42M | 0.43M |
| Reconciled depreciation | 0.61M | 0.81M | 1.81M | 1.53M | 0.04M |
| Ebit | -7.34M | -12.39M | -7.38M | -13.46M | -16.83M |
| Ebitda | -6.44M | -12.27M | -5.57M | -11.93M | -16.78M |
| Depreciation and amortization | 0.90M | 0.12M | 1.81M | 1.53M | 0.04M |
| Operating income | -7.34M | -12.39M | -7.38M | -13.46M | -16.83M |
| Other operating expenses | 11.51M | 15.06M | 13.57M | 23.18M | 18.30M |
| Interest expense | 0.15M | 0.82M | 0.72M | 0.35M | 2.30M |
| Interest income | 0.00M | - | - | - | - |
| Net interest income | -0.15M | -1.51M | -0.72M | -0.35M | -2.30M |
| Income tax expense | 0.57M | 0.82M | 0.72M | 0.35M | -39.38M |
| Total revenue | 4.17M | 2.67M | 6.18M | 9.72M | 1.47M |
| Total operating expenses | 9.21M | 13.11M | 9.20M | 15.88M | 17.26M |
| Cost of revenue | 2.30M | 1.95M | 4.36M | 7.30M | 1.04M |
| Total other income expense net | -0.72M | -22.56M | -7.65M | -30.29M | -39.38M |
| Net income from continuing ops | -8.06M | -34.95M | -15.03M | -43.75M | -58.51M |
| Net income applicable to common shares | - | -34.95M | -15.03M | -43.75M | -58.51M |
| Breakdown | 2023-12-31 | 2022-12-31 | 2021-12-31 | 2020-12-31 | 2019-12-31 |
|---|---|---|---|---|---|
| Type | yearly | yearly | yearly | yearly | yearly |
| Date | 2023-12-31 | 2022-12-31 | 2021-12-31 | 2020-12-31 | 2019-12-31 |
| Total assets | 4.20M | 2.64M | 8.41M | 9.38M | 17.71M |
| Intangible assets | 2.13M | 0.65M | 1.25M | 5.65M | 11.45M |
| Other current assets | 0.15M | 0.06M | 0.01M | 46396.00M | 20200.00M |
| Total liab | 1.99M | 2.65M | 5.49M | 6.49M | 6.79M |
| Total stockholder equity | 2.21M | -0.01M | 2.92M | 2.89M | 10.92M |
| Other current liab | - | 2.50M | 0.69M | 1.09M | 0.96M |
| Common stock | 0.00M | 0.00M | 0.00M | 0.00M | 0.09M |
| Capital stock | 0.00M | 0.00M | 5.43M | 5.82M | 6.07M |
| Retained earnings | -217.04M | -210.51M | -221.12M | -186.17M | -171.14M |
| Good will | 1.35M | 1.35M | 1.35M | 1.35M | 1.35M |
| Other assets | - | - | - | 0.01M | 0.01M |
| Cash | 0.53M | 0.22M | 5.39M | 0.60M | 1.24M |
| Total current liabilities | 1.99M | 2.50M | 2.89M | 4.04M | 4.49M |
| Current deferred revenue | 0.20M | 0.19M | - | - | - |
| Net debt | -0.36M | -0.07M | -2.27M | 2.75M | 1.63M |
| Short term debt | 0.17M | -2.50M | 0.52M | 0.90M | 0.57M |
| Short long term debt | 0.17M | - | 0.52M | 0.90M | 0.57M |
| Short long term debt total | 0.17M | 0.15M | 3.12M | 3.35M | 2.87M |
| Other stockholder equity | 219.25M | 210.50M | 218.61M | 183.24M | 175.98M |
| Property plant equipment | - | - | 0.02M | 0.02M | 0.02M |
| Total current assets | 0.71M | 0.62M | 5.79M | 2.35M | 4.87M |
| Long term investments | - | - | 0.00M | 0.00M | 0.00M |
| Net tangible assets | - | - | -5.11M | -9.93M | -7.86M |
| Short term investments | - | - | - | 0.00M | - |
| Net receivables | 0.03M | 0.34M | 0.39M | 1.70M | 3.61M |
| Long term debt | - | 0.15M | 2.60M | 2.45M | 2.30M |
| Inventory | - | - | - | -46395.95M | -20199.98M |
| Accounts payable | 1.63M | 2.30M | 1.68M | 2.06M | 2.96M |
| Accumulated other comprehensive income | - | - | - | - | -0.01M |
| Non currrent assets other | - | - | - | 0.01M | 0.01M |
| Non current assets total | 3.49M | 2.01M | 2.62M | 7.03M | 12.83M |
| Breakdown | 2022-12-31 | 2021-12-31 | 2020-12-31 | 2019-12-31 | 2018-12-31 |
|---|---|---|---|---|---|
| Type | yearly | yearly | yearly | yearly | yearly |
| Date | 2022-12-31 | 2021-12-31 | 2020-12-31 | 2019-12-31 | 2018-12-31 |
| Investments | -0.01M | 8.88M | 3.62M | 0.17M | 0.17M |
| Change to liabilities | - | -0.37M | -0.90M | 1.70M | 0.80M |
| Total cashflows from investing activities | - | 0.31M | 0.02M | 0.32M | -9.29M |
| Net borrowings | - | 0.03M | 0.49M | 2.92M | -1.81M |
| Total cash from financing activities | 1.03M | 2.04M | 0.49M | 9.02M | 67.63M |
| Change to operating activities | - | -0.62M | 0.10M | -0.10M | -27.57M |
| Net income | -8.06M | -34.95M | -15.03M | -44.03M | -58.51M |
| Change in cash | -5.16M | 4.78M | -0.64M | 0.62M | 0.57M |
| Begin period cash flow | 5.39M | 0.60M | 1.24M | 0.62M | 0.06M |
| End period cash flow | 0.22M | 5.39M | 0.60M | 1.24M | 0.62M |
| Total cash from operating activities | -6.19M | -6.14M | -4.75M | -8.34M | -50.58M |
| Issuance of capital stock | 1.19M | 2.00M | 0.00M | 6.11M | 45.35M |
| Depreciation | 0.61M | 0.81M | 1.81M | 1.53M | 0.04M |
| Other cashflows from investing activities | - | 0.32M | 0.03M | 5.25M | 5.25M |
| Dividends paid | - | - | - | - | 11.42M |
| Change to inventory | 0.00M | - | - | - | 28.07M |
| Change to account receivables | -0.22M | 0.88M | 1.61M | -1.13M | -2.54M |
| Sale purchase of stock | - | - | - | -0.02M | -3.00M |
| Other cashflows from financing activities | -0.01M | 2.12M | -547449.99M | 3.37M | 46.94M |
| Change to netincome | - | 28.12M | 7.67M | 33.40M | 36.97M |
| Capital expenditures | 0.01M | 0.01M | 0.01M | 5.09M | 9.29M |
| Change in working capital | 0.26M | -0.12M | 0.80M | 0.47M | -1.50M |
| Stock based compensation | 0.08M | 4.13M | 1.35M | 6.60M | 0.33M |
| Other non cash items | 0.93M | 1.16M | 0.55M | 0.72M | -25.31M |
| Free cash flow | -6.20M | -6.14M | -4.76M | -13.44M | -59.87M |
Sector: Communication Services Industry: Advertising Agencies
|
Stock Name
|
Change
(USD) |
Price
(USD) |
Trailing
PE (x) |
Forward
PE (x) |
Price Sales
TTM (x) |
Price to Book Value (x)
|
Enterprise Value
to Revenue (x) |
Enterprise Value
to EBITDA (x) |
|---|---|---|---|---|---|---|---|---|
| MOBQ Mobiquity Technologies Inc |
0.04 13.36% |
0.37 | - | - | 4.19 | 1.63 | 2.62 | -0.52 |
| APP Applovin Corp |
-14.79 3.61% |
395.21 | 49.00 | 31.75 | 30.27 | 77.57 | 30.41 | 38.27 |
| PGPEF Publicis Groupe S.A |
- -% |
109.60 | 15.93 | 11.57 | 1.55 | 2.24 | 1.76 | 9.39 |
| PUBGY Publicis Groupe SA |
0.16 0.55% |
29.14 | 16.35 | 11.74 | 1.57 | 2.27 | 1.76 | 9.39 |
| OMC Omnicom Group Inc |
0.56 0.63% |
89.06 | 12.68 | 11.89 | 1.17 | 5.11 | 1.58 | 9.50 |
Mobiquity Technologies, Inc., together with its subsidiaries, operates as an advertising technology, data compliance, and intelligence company in the United States. It provides advertising technology operating system platform comprising adserver, demand side platform, advertisement quality tools, analytics dashboard, avails engine, advertisement prediction and delivery tools, supply quality tools, private marketplace tools, audience and location targeting, wrap up reports, an advertisement software development kit, prebid adaptor, contextual targeting, identity graph capabilities, cookie syncing, and the updated version of a quality and security tools that blends artificial intelligence and machine learning-based optimization technology which automatically serves advertising and manages digital advertising inventory and campaigns. The company also offers data intelligence platform for that provides precise data and insights on consumer's real-world behavior and trends for use in marketing and research; and MobiExchange, a data-focused technology solution that enables users to rapidly build actionable data and insights for its own use, providing out-of-the box private labeling, flexible branding, content management, user management, user communications, subscriptions, payment, invoices, reporting, gateways to third party platforms, and help desk solutions. In addition, it provides content publisher platform, a single-vendor ad tech operating system with tools for consent management, audience building, a direct advertising interface, and inventory enhancement, that allows publishers to better monetize their opt-in user data and advertising inventory. The company was formerly known as Ace Marketing & Promotions, Inc. and changed its name to Mobiquity Technologies, Inc. in September 2013. Mobiquity Technologies, Inc. was incorporated in 1998 and is headquartered in Shoreham, New York.

35 Torrington Lane, Shoreham, NY, United States, 11786

516 246 9422

12
| Name | Title | Year Born |
|---|---|---|
| Mr. Dean L. Julia | Co-Founder, Pres, CEO, Treasurer, Sec. & Director | 1968 |
| Mr. Sean J. McDonnell CPA, CPA | Chief Financial Officer | 1961 |
| Mr. Paul Bauersfeld | Chief Technology Officer | 1963 |
| Mr. Sean Trepeta | Sec. | 1968 |
| Mr. Deepankar Katyal | Chief Exec. Officer of Advangelists | 1986 |
| Mr. Scott J. Novak | Co-Founder | 1968 |
| Mr. Jed Weissberg | Sr. VP of Operations & Fin. | NA |
| Mr. Michael J. Pinkman | Exec. Consultant | 1963 |
| Mr. Dean L. Julia | Co-Founder, President, CEO, Treasurer & Director | 1968 |
| Mr. Sean Trepeta | President of Mobiquity Networks & Secretary of the Company | 1968 |
Disclaimer - (*)This information, including any data, is sourced from Unicorn Data Services SAS, trading as EOD Historical Data (“EODHD”) on an ‘as is’ basis, using their API. We cannot guarantee the completeness or validity of the information and data provided on this page, as well as via the API. In some cases, the data may include analyst ratings or recommendations sourced through the EODHD API, which are intended solely for general information purposes.
This information does not consider your personal objectives, financial situation, or needs. Kalkine is not liable for any errors or omissions in the information provided or for any actions taken in reliance on it. You should seek advice from a financial adviser, stockbroker or other professional adviser (including taxation and legal advice) as necessary before acting on this information.

Download a free report with stock ideas and industry insights for general information.
Download Free Report Now →


Basic Materials
 -1.26%
Communication Services
-0.18%

Consumer Cyclical
-0.36%

Consumer Defensive
 +0.07%

Energy
-0.01%

Financial Services
-0.26%
Financials
-2.20%

Healthcare
-0.55%

Industrials
-0.08%

Real Estate
-0.33%

Technology
-0.70%

Utilities
-0.41%
Note: Daily price change (%) by sector excluding stocks with +/-90% daily price change. Companies above $500 million market capitalization are considered.
 Portfolio
 Watchlist


 Please wait processing your request...