 CA
 NZ
 UK
 AU
 IND

 US


…
Orkla ASA engages in branded consumer goods, and industrial and financial investment businesses. The company offers branded products, including frozen pizza, ketchup, soups, sauces, bread toppings, and ready-to-eat meals through grocery channels, as well as food service, convenience stores, and petrol stations. It also provides confectionery, biscuit, and snack products; and develops bran and crispbread products, as well as energy snack meals. In addition, the company offers personal care and cleaning products; dietary supplement, sport nutrition, and weight control products; wound care products and first aid equipment; painting tools; basic and wool garments for men, women, and children; and professional cleaning products. Further, it operates Gymgrossisten, Proteinfabrikken, Bodystore, and Fitnessmarket e-commerce portals for health and sports nutrition products; and restaurants. Additionally, the company supplies margarine and butter blends, bread and cake improvers and mixes, yeast, marzipan, and ice cream ingredients; produces and supplies hydro power to the Nordic power market; and develops and sells real estate properties. It offers its food products under the Grandiosa, TORO, Stabburet, Felix, Paulúns, NATURLI', Abba, Beauvais, Den Gamle Fabrik, Spilva, and Vitana brands; confectionery and snacks under the KiMs, Nidar, Stratos, Sætre, Göteborgs Kex, OLW, Panda, Laima, Selga, Taffel, Kalev, and Nói Síríus brands; health and sports nutrition under e Zalo, Jif, Bliw, Grumme, Blenda, Define, Möller's, Collett, Nutrilett, Maxim, Norgesplaster, and Salvequick brands; and food ingredients under the Odense, Mors Hjemmebakte, KronJäst, Bakkedal, and NATURLI brands. It has operations in Norway, Sweden, Denmark, Finland, Iceland, the Baltics, rest of Europe, and internationally. The company was founded in 1918 and is headquartered in Oslo, Norway.
Source: TradingView
The charts and visual representations are sourced from TradingView through embedded widgets. For any issues with chart display, please visit the TradingView website
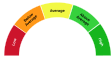
A unique technical analysis driven score developed by Kalkine showing momentum in stock prices based on select technical indicators identified.
Orkla ASA is a Norway-based branded consumer goods group that develops, manufactures and sells food, snacks, personal- and home-care products across the Nordic region and selected international markets.
Its long-term growth may be supported by a diversified local brand portfolio, cost and supply-chain initiatives, selective acquisitions and channel expansion, which could support steady cash generation and dividend capacity. Key risks include sensitivity to commodity and packaging cost swings, currency and macroeconomic exposure in core markets, competitive pressure from private labels and execution risk on acquisitions.

Note: The summary and risk score provided above is created by AI and should not be construed as a recommendation of Kalkine.


| Breakdown | 2022-12-31 | 2021-12-31 | 2020-12-31 | 2019-12-31 | 2018-12-31 |
|---|---|---|---|---|---|
| Type | yearly | yearly | yearly | yearly | yearly |
| Date | 2022-12-31 | 2021-12-31 | 2020-12-31 | 2019-12-31 | 2018-12-31 |
| Income before tax | 7345.00M | 6366.00M | 5348.00M | 4931.00M | 4358.00M |
| Minority interest | -249.00M | -90.00M | 462.00M | 460.00M | 436.00M |
| Net income | 5019.00M | 4808.00M | 4371.00M | 3838.00M | 3272.00M |
| Selling general administrative | 727.00M | 640.00M | 565.00M | 598.00M | 519.00M |
| Selling and marketing expenses | 4038.00M | 3323.00M | 2963.00M | 2637.00M | 2417.00M |
| Gross profit | 29523.00M | 25270.00M | 23707.00M | 21919.00M | 20489.00M |
| Reconciled depreciation | 2404.00M | 2092.00M | 2454.00M | 2221.00M | 1270.00M |
| Ebit | 6897.00M | 5730.00M | 6353.00M | 4527.00M | 4926.00M |
| Ebitda | 10663.00M | 9028.00M | 8807.00M | 7939.00M | 6196.00M |
| Depreciation and amortization | 3766.00M | 3298.00M | 2454.00M | 3412.00M | 1270.00M |
| Non operating income net other | - | - | - | - | 0.00M |
| Operating income | 6897.00M | 5730.00M | 6353.00M | 4527.00M | 4295.00M |
| Other operating expenses | 51033.00M | 44365.00M | 41781.00M | 38607.00M | 36174.00M |
| Interest expense | 428.00M | 220.00M | 202.00M | 238.00M | 170.00M |
| Tax provision | 2077.00M | 1468.00M | 926.00M | 1033.00M | 1004.00M |
| Interest income | 52.00M | 30.00M | 20.00M | 18.00M | 24.00M |
| Net interest income | -415.00M | -221.00M | -210.00M | -243.00M | -171.00M |
| Extraordinary items | - | - | - | - | 0.00M |
| Non recurring | - | - | - | - | 0.00M |
| Other items | - | - | - | - | 0.00M |
| Income tax expense | 2077.00M | 1468.00M | 926.00M | 1033.00M | 1004.00M |
| Total revenue | 58391.00M | 50441.00M | 47137.00M | 43615.00M | 40837.00M |
| Total operating expenses | 22165.00M | 19194.00M | 18351.00M | 16911.00M | 15826.00M |
| Cost of revenue | 28868.00M | 25171.00M | 23430.00M | 21696.00M | 20348.00M |
| Total other income expense net | 448.00M | 636.00M | -1005.00M | 404.00M | 63.00M |
| Discontinued operations | - | - | - | - | 0.00M |
| Net income from continuing ops | 5268.00M | 4898.00M | 4422.00M | 3898.00M | 3354.00M |
| Net income applicable to common shares | 5019.00M | 4808.00M | 4371.00M | 3838.00M | 3272.00M |
| Preferred stock and other adjustments | - | - | - | - | 0.00M |
| Breakdown | 2022-12-31 | 2021-12-31 | 2020-12-31 | 2019-12-31 | 2018-12-31 |
|---|---|---|---|---|---|
| Type | yearly | yearly | yearly | yearly | yearly |
| Date | 2022-12-31 | 2021-12-31 | 2020-12-31 | 2019-12-31 | 2018-12-31 |
| Total assets | 80671.00M | 70564.00M | 63007.00M | 57413.00M | 52509.00M |
| Intangible assets | 8931.00M | 8468.00M | 6844.00M | 6194.00M | 5904.00M |
| Other current assets | - | 7993.00M | 7373.00M | 7221.00M | 6976.00M |
| Total liab | 37515.00M | 31213.00M | 25303.00M | 22501.00M | 18429.00M |
| Total stockholder equity | 41686.00M | 38441.00M | 37242.00M | 34452.00M | 33629.00M |
| Deferred long term liab | - | - | - | - | 0.00M |
| Other current liab | 5426.00M | 4334.00M | 3683.00M | 3524.00M | 2278.00M |
| Common stock | 1252.00M | 1252.00M | 1252.00M | 1252.00M | 1274.00M |
| Capital stock | 1252.00M | 1252.00M | 1252.00M | 1252.00M | 1274.00M |
| Retained earnings | 39718.00M | 36474.00M | 35270.00M | 32480.00M | 31658.00M |
| Other liab | - | 5187.00M | 4896.00M | 4672.00M | 4347.00M |
| Good will | 24693.00M | 22086.00M | 17365.00M | 16533.00M | 14673.00M |
| Other assets | - | 570.00M | 458.00M | 314.00M | 204.00M |
| Cash | 1180.00M | 917.00M | 3032.00M | 1493.00M | 1806.00M |
| Total current liabilities | 17654.00M | 15223.00M | 10873.00M | 9918.00M | 9028.00M |
| Current deferred revenue | - | - | - | - | 1492.00M |
| Net debt | 17591.00M | 13402.00M | 6971.00M | 7078.00M | 3320.00M |
| Short term debt | 4094.00M | 3603.00M | 664.00M | 803.00M | 351.00M |
| Short long term debt | 3651.00M | 3195.00M | 329.00M | 442.00M | 351.00M |
| Short long term debt total | 18771.00M | 14319.00M | 10003.00M | 8571.00M | 5126.00M |
| Other stockholder equity | 716.00M | 715.00M | 720.00M | 720.00M | 697.00M |
| Property plant equipment | 19138.00M | 17458.00M | 16274.00M | 15402.00M | 14043.00M |
| Total current assets | 20966.00M | 16444.00M | 17031.00M | 14673.00M | 14802.00M |
| Long term investments | - | - | - | 4321.00M | 4166.00M |
| Net tangible assets | - | 7887.00M | 13033.00M | 11725.00M | 12940.00M |
| Short term investments | - | - | - | 1.00M | 13.00M |
| Net receivables | 7706.00M | 7129.00M | 6648.00M | 6430.00M | 6320.00M |
| Long term debt | 13148.00M | 9200.00M | 8187.00M | 6473.00M | 4775.00M |
| Inventory | 10359.00M | 7534.00M | 6626.00M | 5958.00M | 6007.00M |
| Accounts payable | 8134.00M | 7286.00M | 6526.00M | 5591.00M | 4907.00M |
| Total permanent equity | - | - | - | - | 0.00M |
| Noncontrolling interest in consolidated entity | - | - | - | - | 0.00M |
| Temporary equity redeemable noncontrolling interests | - | - | - | - | 0.00M |
| Accumulated other comprehensive income | - | - | - | - | 0.00M |
| Additional paid in capital | - | - | - | - | 0.00M |
| Common stock total equity | - | - | - | - | 0.00M |
| Preferred stock total equity | - | - | - | - | 0.00M |
| Retained earnings total equity | - | - | - | - | 0.00M |
| Treasury stock | - | - | - | - | 0.00M |
| Accumulated amortization | - | - | - | - | 0.00M |
| Non currrent assets other | 6857.00M | 5979.00M | 5368.00M | 307.00M | 263.00M |
| Deferred long term asset charges | - | - | - | - | 0.00M |
| Non current assets total | 59705.00M | 54120.00M | 45976.00M | 42740.00M | 37707.00M |
| Capital lease obligations | 1972.00M | 1924.00M | 1487.00M | 1656.00M | 0.00M |
| Long term debt total | - | - | - | - | 0.00M |
| Breakdown | 2022-12-31 | 2021-12-31 | 2020-12-31 | 2019-12-31 | 2018-12-31 |
|---|---|---|---|---|---|
| Type | yearly | yearly | yearly | yearly | yearly |
| Date | 2022-12-31 | 2021-12-31 | 2020-12-31 | 2019-12-31 | 2018-12-31 |
| Investments | -5557.00M | -8361.00M | -2924.00M | -5091.00M | -3261.00M |
| Change to liabilities | 0.00M | 0.00M | 0.00M | 0.00M | 0.00M |
| Total cashflows from investing activities | -5557.00M | -8361.00M | -2924.00M | -5091.00M | -3261.00M |
| Net borrowings | - | 3122.00M | 389.00M | 1400.00M | -36.00M |
| Total cash from financing activities | 659.00M | -31.00M | -2285.00M | -1340.00M | -3979.00M |
| Change to operating activities | - | -645.00M | 672.00M | 471.00M | -314.00M |
| Net income | 7345.00M | 6366.00M | 5348.00M | 4931.00M | 4358.00M |
| Change in cash | 375.00M | -2086.00M | 1544.00M | -309.00M | -2856.00M |
| Begin period cash flow | 1127.00M | 3213.00M | 1669.00M | 1978.00M | 4834.00M |
| End period cash flow | 1502.00M | 1127.00M | 3213.00M | 1669.00M | 1978.00M |
| Total cash from operating activities | 5230.00M | 6353.00M | 6598.00M | 6121.00M | 4388.00M |
| Issuance of capital stock | 43.00M | 57.00M | 57.00M | 59.00M | 57.00M |
| Depreciation | 2404.00M | 2092.00M | 2454.00M | 2221.00M | 1270.00M |
| Other cashflows from investing activities | 13.00M | 56.00M | 29.00M | -197.00M | -42.00M |
| Dividends paid | 3047.00M | 2784.00M | 2666.00M | 2648.00M | 2685.00M |
| Change to inventory | - | - | - | - | 0.00M |
| Change to account receivables | - | - | - | - | 0.00M |
| Sale purchase of stock | 0.00M | -403.00M | 416.00M | 1834.00M | -1435.00M |
| Other cashflows from financing activities | 4443.00M | 5113.00M | -65.00M | -151.00M | 93.00M |
| Change to netincome | - | 119.00M | -388.00M | 74.00M | 222.00M |
| Capital expenditures | 2823.00M | 2687.00M | 2607.00M | 2522.00M | 2332.00M |
| Change receivables | - | - | - | - | 0.00M |
| Cash flows other operating | - | - | - | - | 0.00M |
| Exchange rate changes | - | - | - | - | 0.00M |
| Cash and cash equivalents changes | - | - | - | - | 0.00M |
| Change in working capital | -2595.00M | -645.00M | 672.00M | 471.00M | -314.00M |
| Other non cash items | -1924.00M | -1460.00M | -1876.00M | -1502.00M | -926.00M |
| Free cash flow | 2407.00M | 3666.00M | 3991.00M | 3599.00M | 2056.00M |
Sector: Consumer Defensive Industry: Packaged Foods
|
Stock Name
|
Change
(USD) |
Price
(USD) |
Trailing
PE (x) |
Forward
PE (x) |
Price Sales
TTM (x) |
Price to Book Value (x)
|
Enterprise Value
to Revenue (x) |
Enterprise Value
to EBITDA (x) |
|---|---|---|---|---|---|---|---|---|
| ORKLY Orkla ASA ADR |
-0.03 0.27% |
10.98 | 14.58 | 13.30 | 0.11 | 1.74 | 0.14 | 0.87 |
| NSRGF Nestle SA |
- -% |
101.69 | 26.86 | 18.76 | 3.13 | 7.10 | 3.81 | 21.70 |
| NSRGY Nestle SA ADR |
0.07 0.07% |
103.51 | 26.82 | 18.66 | 3.18 | 7.07 | 3.81 | 21.70 |
| DANOY Danone PK |
0.23 1.52% |
15.40 | 24.23 | 17.64 | 1.88 | 2.57 | 1.88 | 11.70 |
| GPDNF Danone S.A |
- -% |
75.00 | 20.30 | 14.75 | 1.65 | 2.24 | 1.76 | 10.92 |
Orkla ASA engages in branded consumer goods, and industrial and financial investment businesses. The company offers branded products, including frozen pizza, ketchup, soups, sauces, bread toppings, and ready-to-eat meals through grocery channels, as well as food service, convenience stores, and petrol stations. It also provides confectionery, biscuit, and snack products; and develops bran and crispbread products, as well as energy snack meals. In addition, the company offers personal care and cleaning products; dietary supplement, sport nutrition, and weight control products; wound care products and first aid equipment; painting tools; basic and wool garments for men, women, and children; and professional cleaning products. Further, it operates Gymgrossisten, Proteinfabrikken, Bodystore, and Fitnessmarket e-commerce portals for health and sports nutrition products; and restaurants. Additionally, the company supplies margarine and butter blends, bread and cake improvers and mixes, yeast, marzipan, and ice cream ingredients; produces and supplies hydro power to the Nordic power market; and develops and sells real estate properties. It offers its food products under the Grandiosa, TORO, Stabburet, Felix, Paulúns, NATURLI', Abba, Beauvais, Den Gamle Fabrik, Spilva, and Vitana brands; confectionery and snacks under the KiMs, Nidar, Stratos, Sætre, Göteborgs Kex, OLW, Panda, Laima, Selga, Taffel, Kalev, and Nói Síríus brands; health and sports nutrition under e Zalo, Jif, Bliw, Grumme, Blenda, Define, Möller's, Collett, Nutrilett, Maxim, Norgesplaster, and Salvequick brands; and food ingredients under the Odense, Mors Hjemmebakte, KronJäst, Bakkedal, and NATURLI brands. It has operations in Norway, Sweden, Denmark, Finland, Iceland, the Baltics, rest of Europe, and internationally. The company was founded in 1918 and is headquartered in Oslo, Norway.
| Name | Title | Year Born |
|---|---|---|
| Mr. Nils Kloumann Selte | Pres & CEO | 1965 |
| Mr. Harald Ullevoldsæter | Exec. VP, CFO & Member of Group Exec. Board | 1963 |
| Mr. Atle Vidar Nagel-Johansen | Exec. VP of Orkla's Branded Consumer Goods Bus. & Member of Group Exec. Board | 1963 |
| Mr. Johan Clarin | Exec. VP, CEO of Orkla Food Ingredients & Member of Group Exec. Board | 1971 |
| Mr. Christer Gronberg | Exec. VP of Corp. Functions & Member of Group Exec. Board | 1961 |
| Ms. Hege Holter Brekke | EVP, CEO of Orkla Care & Member of Group Exec. Board | 1969 |
| Mr. Sverre Prytz | Exec. VP of M&A and Strategy and Member of Group Exec. Board | NA |
| Ms. Ingvill T. Berg | Exec. VP, CEO of Orkla Confectionery & Snacks & Member of Group Exec. Board | 1976 |
| Mr. Håkon Mageli | Corp. Communications & Corp. Affairs and Member of Group Exec. Board & Group Director | 1964 |
| Mr. Kenneth Haavet | Exec. Officer | 1980 |
Disclaimer - (*)This information, including any data, is sourced from Unicorn Data Services SAS, trading as EOD Historical Data (“EODHD”) on an ‘as is’ basis, using their API. We cannot guarantee the completeness or validity of the information and data provided on this page, as well as via the API. In some cases, the data may include analyst ratings or recommendations sourced through the EODHD API, which are intended solely for general information purposes.
This information does not consider your personal objectives, financial situation, or needs. Kalkine is not liable for any errors or omissions in the information provided or for any actions taken in reliance on it. You should seek advice from a financial adviser, stockbroker or other professional adviser (including taxation and legal advice) as necessary before acting on this information.

Download a free report with stock ideas and industry insights for general information.
Download Free Report Now →


Basic Materials
 -1.40%
Communication Services
-0.45%

Consumer Cyclical
-0.55%

Consumer Defensive
-0.01%

Energy
-0.01%

Financial Services
-0.40%
Financials
-0.15%

Healthcare
-1.15%

Industrials
-0.46%

Real Estate
-0.29%

Technology
-1.22%

Utilities
-0.10%
Note: Daily price change (%) by sector excluding stocks with +/-90% daily price change. Companies above $500 million market capitalization are considered.
 Portfolio
 Watchlist


 +0.55%
 Please wait processing your request...