 CA
 NZ
 UK
 AU
 IND

 US


…
Sumitomo Electric Industries, Ltd. manufactures and sells various materials in Japan and internationally. It operates in Environment and Energy, Infocommunications, Automotive, Electronics, and Industrial Materials and Others segments. It offers vanadium redox flow battery, high voltage cable, sEMSA, industrial electric wires and cables, traveling cable, railway and transport machinery products, aluminum materials, heat shrink tubing and heat-resistant tubing/tapes, thermal control devices, and water treatment membrane; and fiber optic, fusion splicer and accessories, data center solutions, remote monitoring of FTTx distribution line, NanoPlug, CATV systems, set top box, optical and wireless devices, AirMT, non-contact multi-fiber interconnect, and low profile fiber-array. The company also provides electric wires and cables for automobiles, components for wiring harnesses, electronics, HVs and EVs, pedestrian radar, steel cords for tire reinforcement, steel wires for springs, abrasion-resistant parts, magnet wires, sintered ZnS lenses, wiring materials/electronics, sintered components, copper-diamond/molybdenum/ tungsten, chemical vapor deposition-diamond, single crystal, magnesium-silicon carbide, diamond/CBN cutting tool, dies wire drawing tool, and dresser, and aluminum nitride. In addition, it offers electronic wires, flexible printed circuit, heat-shrinkable tubing, nickel alloy/cladded/plated wire, metal foam/electroplated wire, POREFLON PTFE membrane, the cross linked fluorine resin FEX, spiral shielded wires, coaxial cables, flat components, thunderbolt and USB4 cables, plated and alloy wires, and RGB laser modules; and PC steel wires, drills/endmills, CBN/PCD, milling and turning tools, and laser optics. The company was formerly known as Sumitomo Electric Wire & Cable Works and changed its name to Sumitomo Electric Industries, Ltd. in January 1939. Sumitomo Electric Industries, Ltd. was founded in 1897 and is headquartered in Chuo, Japan.
Source: TradingView
The charts and visual representations are sourced from TradingView through embedded widgets. For any issues with chart display, please visit the TradingView website
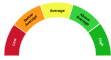
A unique technical analysis driven score developed by Kalkine showing momentum in stock prices based on select technical indicators identified.
Sumitomo Electric Industries is a diversified Japanese maker of wires and cables, optical fiber and components, automotive wiring systems and power and industrial products. Long-term growth drivers include automotive electrification, expanding broadband/5G networks and grid modernization that may increase demand for its wiring, optical and power materials. Its diversified end markets and technology capabilities appear positioned to support steady revenue over time.
Principal risks include automotive and industrial cyclicality, currency and commodity exposure, and competitive and execution pressures in capital-intensive businesses that investors should monitor.

Note: The summary and risk score provided above is created by AI and should not be construed as a recommendation of Kalkine.


| Breakdown | 2026-03-31 | 2025-03-31 | 2024-03-31 | 2023-03-31 | 2022-03-31 |
|---|---|---|---|---|---|
| Type | yearly | yearly | yearly | yearly | yearly |
| Date | 2026-03-31 | 2025-03-31 | 2024-03-31 | 2023-03-31 | 2022-03-31 |
| Income before tax | 535624.05M | 304064.00M | 238545.00M | 196472.00M | 159921.00M |
| Minority interest | -31638.00M | -28055.00M | -19238.00M | -19619.00M | -13396.00M |
| Net income | 391792.23M | 193771.00M | 149723.00M | 112654.00M | 96306.00M |
| Selling general administrative | - | 370029.00M | - | 320618.00M | 289115.00M |
| Selling and marketing expenses | - | 113608.00M | - | 111040.00M | 103384.00M |
| Gross profit | 1096391.18M | 880126.00M | 767588.00M | 669976.00M | 573944.00M |
| Reconciled depreciation | 212762.00M | 206839.00M | 206333.00M | 196066.00M | 181351.00M |
| Ebit | 443392.11M | 333813.00M | 267866.00M | 193080.00M | 158122.00M |
| Ebitda | 665889.23M | 540652.00M | 474199.00M | 389146.00M | 339473.00M |
| Depreciation and amortization | 222497.12M | 206839.00M | 206333.00M | 196066.00M | 181351.00M |
| Operating income | 443392.11M | 320663.00M | 226618.00M | 177443.00M | 122195.00M |
| Other operating expenses | 4974962.29M | 4359126.00M | 4176196.00M | 3828118.00M | 3245668.00M |
| Interest expense | 25147.32M | 29749.00M | 29321.00M | 16107.00M | 5559.00M |
| Tax provision | 104013.00M | 82238.00M | 69584.00M | 64199.00M | 50219.00M |
| Interest income | 3909.00M | 3744.00M | 2794.00M | 1533.00M | 1022.00M |
| Net interest income | -19808.00M | -26005.00M | -26527.00M | -14574.00M | -4537.00M |
| Income tax expense | 110285.80M | 82238.00M | 69584.00M | 64199.00M | 50219.00M |
| Total revenue | 5418354.41M | 4679789.00M | 4402814.00M | 4005561.00M | 3367863.00M |
| Total operating expenses | 652999.07M | 559463.00M | 540970.00M | 492533.00M | 451749.00M |
| Cost of revenue | 4321963.22M | 3799663.00M | 3635226.00M | 3335585.00M | 2793919.00M |
| Total other income expense net | 92231.94M | -16599.00M | 11927.00M | 19029.00M | 37726.00M |
| Net income from continuing ops | 401146.00M | 221826.00M | 168961.00M | 132273.00M | 109702.00M |
| Net income applicable to common shares | - | - | - | - | 96306.00M |
| Breakdown | 2026-03-31 | 2025-03-31 | 2024-03-31 | 2023-03-31 | 2022-03-31 |
|---|---|---|---|---|---|
| Type | yearly | yearly | yearly | yearly | yearly |
| Date | 2026-03-31 | 2025-03-31 | 2024-03-31 | 2023-03-31 | 2022-03-31 |
| Total assets | 4845456.80M | 4441629.00M | 4365397.00M | 4013008.00M | 3807390.00M |
| Intangible assets | 40730.89M | 40979.00M | 39831.00M | 36682.00M | 36062.00M |
| Other current assets | 226299.26M | 189272.00M | 186414.00M | 152407.00M | 137833.00M |
| Total liab | 1998161.94M | 1911192.00M | 1933509.00M | 1902189.00M | 1754452.00M |
| Total stockholder equity | 2755332.73M | 2290394.00M | 2207662.00M | 1899879.00M | 1769788.00M |
| Other current liab | 408667.81M | 428857.00M | 290921.00M | 257669.00M | 241923.00M |
| Common stock | 100169.58M | 99737.00M | 99737.00M | 99737.00M | 99737.00M |
| Capital stock | 99737.00M | 99737.00M | 99737.00M | 99737.00M | 99737.00M |
| Retained earnings | 1911888.37M | 1618695.00M | 1493708.00M | 1383046.00M | 1346210.00M |
| Other liab | - | - | - | 166816.00M | 149638.00M |
| Good will | 21624.38M | 20399.00M | 3.00M | - | - |
| Other assets | - | - | - | - | 32329.00M |
| Cash | 238009.83M | 295903.00M | 268273.00M | 283425.00M | 259581.00M |
| Total current liabilities | 1353601.44M | 1286843.00M | 1307370.00M | 1399407.00M | 1260094.00M |
| Current deferred revenue | 114076.63M | 651.71M | 74263.00M | 87550.00M | 72978.00M |
| Net debt | 474870.70M | 460659.00M | 533226.00M | 660778.00M | 585347.00M |
| Short term debt | 341087.97M | 346710.00M | 412128.00M | 608237.00M | 500208.00M |
| Short long term debt | 318999.00M | 346710.00M | 395575.00M | 608237.00M | 500208.00M |
| Short long term debt total | 712880.53M | 756562.00M | 801499.00M | 944203.00M | 844928.00M |
| Other stockholder equity | 121671.43M | 144501.00M | 144621.00M | 417096.00M | 323841.00M |
| Property plant equipment | - | - | - | - | 1026784.00M |
| Total current assets | 2435126.94M | 2320091.00M | 2242215.00M | 2162688.00M | 2056928.00M |
| Net tangible assets | - | - | - | - | 1733726.00M |
| Short term investments | - | - | 1471.00M | -216159.00M | -211391.00M |
| Net receivables | 948253.98M | 911918.00M | 901040.00M | 840399.00M | 782328.00M |
| Long term debt | 301543.00M | 341281.00M | 339469.00M | 290442.00M | 307088.00M |
| Inventory | 1022563.88M | 922998.00M | 885017.00M | 851224.00M | 844837.00M |
| Accounts payable | 489769.04M | 473834.00M | 479831.00M | 445951.00M | 444985.00M |
| Accumulated other comprehensive income | 621603.35M | 427461.00M | 469596.00M | - | - |
| Non currrent assets other | 395398.50M | 294575.00M | 346142.00M | 40162.00M | 655287.00M |
| Non current assets total | 2410329.86M | 2121538.00M | 2123182.00M | 1850320.00M | 1750462.00M |
| Capital lease obligations | 68644.00M | 68571.00M | 49902.00M | 45524.00M | 37632.00M |
| Breakdown | 2026-03-31 | 2025-03-31 | 2024-03-31 | 2023-03-31 | 2022-03-31 |
|---|---|---|---|---|---|
| Type | yearly | yearly | yearly | yearly | yearly |
| Date | 2026-03-31 | 2025-03-31 | 2024-03-31 | 2023-03-31 | 2022-03-31 |
| Investments | 7521.00M | -223904.00M | -123809.00M | -147821.00M | 15065.00M |
| Change to liabilities | - | - | - | 0.00M | 33272.00M |
| Total cashflows from investing activities | -185407.55M | -223904.00M | -123809.00M | - | -165447.00M |
| Net borrowings | -91731.00M | -51131.00M | -213273.00M | - | 141599.00M |
| Total cash from financing activities | -345693.23M | -150825.00M | -292313.00M | -98290.00M | 82816.00M |
| Change to operating activities | - | - | - | -27984.00M | -30184.00M |
| Net income | 391792.23M | 304064.00M | 149723.00M | 196472.00M | 159921.00M |
| Change in cash | -76642.66M | 26214.00M | -11159.00M | 23892.00M | 4099.00M |
| Begin period cash flow | 314652.49M | 268273.00M | 279432.00M | 255540.00M | 251441.00M |
| End period cash flow | 238009.83M | 294487.00M | 268273.00M | 279432.00M | 255540.00M |
| Total cash from operating activities | 450834.41M | 402253.00M | 393465.00M | 265191.00M | 76002.00M |
| Depreciation | 222497.12M | 206839.00M | 206333.00M | 196066.00M | 181351.00M |
| Other cashflows from investing activities | 31738.19M | -14729.00M | -11175.00M | - | -15448.00M |
| Dividends paid | 91809.94M | 68646.00M | 39004.00M | -39004.00M | -31983.00M |
| Change to inventory | -50773.90M | -17539.00M | 21281.00M | 26540.00M | -195098.00M |
| Change to account receivables | -74650.97M | -946.00M | 4886.00M | -41241.00M | -27414.00M |
| Sale purchase of stock | -13.78M | -4.00M | -4.00M | -3.00M | -12.00M |
| Other cashflows from financing activities | -156606.41M | -31044.00M | -40032.00M | -91453.00M | -53.00M |
| Change to netincome | - | - | - | -77340.00M | -45846.00M |
| Capital expenditures | 235630.09M | 199824.00M | 179323.00M | 184467.00M | 174059.00M |
| Change in working capital | -202479.57M | -38969.00M | 40112.00M | -35299.00M | -192550.00M |
| Other non cash items | 39024.63M | -69681.00M | -2703.00M | -92048.00M | -72720.00M |
| Free cash flow | 215204.32M | 202429.00M | 214142.00M | 80724.00M | -98057.00M |
Sector: Consumer Cyclical Industry: Auto Parts
|
Stock Name
|
Change
(USD) |
Price
(USD) |
Trailing
PE (x) |
Forward
PE (x) |
Price Sales
TTM (x) |
Price to Book Value (x)
|
Enterprise Value
to Revenue (x) |
Enterprise Value
to EBITDA (x) |
|---|---|---|---|---|---|---|---|---|
| SMTOY Sumitomo Electric Industries Ltd ADR |
0.10 2.00% |
5.09 | 16.31 | 18.35 | 0.01 | 2.16 | 1.31 | 9.05 |
| ORLY O’Reilly Automotive Inc |
- -% |
89.99 | 27.74 | 23.75 | 3.71 | 206.18 | 4.30 | 19.07 |
| AZO AutoZone Inc |
- -% |
3200.00 | 25.25 | 24.21 | 3.05 | 13.38 | 3.65 | 17.03 |
| SMTOF Sumitomo Electric Industries Ltd |
-0.08 0.73% |
10.30 | 17.90 | 20.41 | 0.01 | 2.40 | 1.31 | 9.00 |
| DNZOF DENSO Corporation |
0.25 2.18% |
11.70 | 15.84 | 12.36 | 0.01 | 1.04 | 0.71 | 5.53 |
Sumitomo Electric Industries, Ltd. manufactures and sells various materials in Japan and internationally. It operates in Environment and Energy, Infocommunications, Automotive, Electronics, and Industrial Materials and Others segments. It offers vanadium redox flow battery, high voltage cable, sEMSA, industrial electric wires and cables, traveling cable, railway and transport machinery products, aluminum materials, heat shrink tubing and heat-resistant tubing/tapes, thermal control devices, and water treatment membrane; and fiber optic, fusion splicer and accessories, data center solutions, remote monitoring of FTTx distribution line, NanoPlug, CATV systems, set top box, optical and wireless devices, AirMT, non-contact multi-fiber interconnect, and low profile fiber-array. The company also provides electric wires and cables for automobiles, components for wiring harnesses, electronics, HVs and EVs, pedestrian radar, steel cords for tire reinforcement, steel wires for springs, abrasion-resistant parts, magnet wires, sintered ZnS lenses, wiring materials/electronics, sintered components, copper-diamond/molybdenum/ tungsten, chemical vapor deposition-diamond, single crystal, magnesium-silicon carbide, diamond/CBN cutting tool, dies wire drawing tool, and dresser, and aluminum nitride. In addition, it offers electronic wires, flexible printed circuit, heat-shrinkable tubing, nickel alloy/cladded/plated wire, metal foam/electroplated wire, POREFLON PTFE membrane, the cross linked fluorine resin FEX, spiral shielded wires, coaxial cables, flat components, thunderbolt and USB4 cables, plated and alloy wires, and RGB laser modules; and PC steel wires, drills/endmills, CBN/PCD, milling and turning tools, and laser optics. The company was formerly known as Sumitomo Electric Wire & Cable Works and changed its name to Sumitomo Electric Industries, Ltd. in January 1939. Sumitomo Electric Industries, Ltd. was founded in 1897 and is headquartered in Chuo, Japan.
| Name | Title | Year Born |
|---|---|---|
| Mr. Masayoshi Matsumoto | Chairman & CEO | 1944 |
| Mr. Osamu Inoue | Pres, COO & Director | 1952 |
| Mr. Akira Nishimura | Sr. MD, GM of R&D Unit Electronics Group and Director | 1958 |
| Mr. Mitsuo Nishida | Exec. VP, GM of Automotive Bus. Division & Director | 1948 |
| Mr. Yasuhiro Miyata | MD, GM of Electronics Sales Unit & Director | 1961 |
| Mr. Masaki Shirayama | MD, GM of Electric Wire & Cable of Energy Bus. Unit and Director | 1961 |
| Mr. Shigeru Nakajima | MD, GM of Semiconductor innovation business Unit & Director | 1959 |
| Yasuyuki Shibata | Managing Exec. Officer & Deputy GM of Electronics Sales Division | NA |
| Mr. Hideo Hato | Sr. MD, GM of New Buss Dev. Unit, Deputy GM of Automotive Bus of Systems & Elect Div and Director | 1957 |
| Mr. Masahiro Kobayashi | Managing Exec. Officer and Deputy GM of R&D Division | NA |
Disclaimer - (*)This information, including any data, is sourced from Unicorn Data Services SAS, trading as EOD Historical Data (“EODHD”) on an ‘as is’ basis, using their API. We cannot guarantee the completeness or validity of the information and data provided on this page, as well as via the API. In some cases, the data may include analyst ratings or recommendations sourced through the EODHD API, which are intended solely for general information purposes.
This information does not consider your personal objectives, financial situation, or needs. Kalkine is not liable for any errors or omissions in the information provided or for any actions taken in reliance on it. You should seek advice from a financial adviser, stockbroker or other professional adviser (including taxation and legal advice) as necessary before acting on this information.

Download a free report with stock ideas and industry insights for general information.
Download Free Report Now →


Basic Materials
 -0.39%
Communication Services
 +0.40%

Consumer Cyclical
-0.20%

Consumer Defensive
-0.56%

Energy
-0.45%

Financial Services
-0.09%
Financials
+0.11%

Healthcare
+0.40%

Industrials
+0.34%

Real Estate
-0.14%

Technology
+0.88%

Utilities
+0.11%
Note: Daily price change (%) by sector excluding stocks with +/-90% daily price change. Companies above $500 million market capitalization are considered.
 Portfolio
 Watchlist


 Please wait processing your request...