 CA
 NZ
 UK
 AU
 IND

 US


…
TP ICAP Group PLC provides intermediary services, contextual insights, trade execution, pre-trade and settlement services, and data-led solutions in Europe, the Middle East, Africa, the Americas, and the Asia Pacific. It operates through Global Broking, Energy & Commodities, Liquidnet, and Parameta Solutions divisions. The Global Broking division operates in rates, foreign exchange (FX) and money markets, equities, and credit products; and offers broking, facilitating price discovery, and liquidity services. The Energy & Commodities division operates in various commodities markets, including oil, gas, power, renewables, ferrous metals, base metals, precious metals, soft commodities, and digital assets. This division also assists in canvassing the market for expressions of interest, intelligence gathering, negotiations, and post-transaction processing; and provides insights on the impact of unpredictable factors, such as weather conditions, geopolitics, and exchange rate movements. The Liquidnet division operates Liquidnet, a cash equities dark/block electronic trading network; and Coex Partners, a trade advisory and agency execution service that covers listed derivatives, FX, government bonds, cleared interest rate swaps, and cash equities. This division serves hedge funds, asset managers, and asset owners. The Parameta Solutions division provides unbiased data products that facilitate trading, enhance transparency, reduce risk, and enhance operational efficiency; and pricing, reference data, and analytical tools . This division also offers real-time price information for the OTC financial and commodity markets delivering independent data for various asset classes, including rates, FX and money markets, volatility, oil, energy, inflation, credit, and equities. TP ICAP Group PLC is based in Saint Helier, Jersey.
Source: TradingView
The charts and visual representations are sourced from TradingView through embedded widgets. For any issues with chart display, please visit the TradingView website
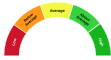
A unique technical analysis driven score developed by Kalkine showing momentum in stock prices based on select technical indicators identified.


| Breakdown | 2025-12-31 | 2024-12-31 | 2023-12-31 | 2022-12-31 | 2021-12-31 |
|---|---|---|---|---|---|
| Type | yearly | yearly | yearly | yearly | yearly |
| Date | 2025-12-31 | 2024-12-31 | 2023-12-31 | 2022-12-31 | 2021-12-31 |
| Income before tax | 249.96M | 233.00M | 116.00M | 113.00M | 24.00M |
| Minority interest | -3.00M | -3.00M | -2.00M | -3.00M | -3.00M |
| Net income | 185.97M | 167.00M | 74.00M | 103.00M | 5.00M |
| Selling general administrative | 285.00M | 273.00M | 477.00M | 294.00M | 241.00M |
| Selling and marketing expenses | - | - | 1382.00M | - | - |
| Gross profit | 2247.64M | 793.00M | 762.00M | 599.00M | 792.00M |
| Reconciled depreciation | 115.00M | 114.00M | 117.00M | 127.00M | 128.00M |
| Ebit | 317.95M | 274.00M | 159.00M | 200.00M | 140.00M |
| Ebitda | 432.93M | 388.00M | 276.00M | 327.00M | 268.00M |
| Depreciation and amortization | 114.98M | 114.00M | 117.00M | 127.00M | 128.00M |
| Operating income | 260.96M | 82.00M | 64.00M | 163.00M | 97.00M |
| Other operating expenses | 2101.66M | 2108.00M | 2061.00M | 1940.00M | 1703.00M |
| Interest expense | 67.99M | 60.00M | 63.00M | 41.00M | 54.00M |
| Tax provision | 61.00M | 63.00M | 40.00M | 36.00M | 23.00M |
| Interest income | 36.00M | 42.00M | 34.00M | 8.00M | 3.00M |
| Net interest income | -32.00M | -21.00M | -32.00M | -37.00M | -73.00M |
| Income tax expense | 60.99M | 63.00M | 40.00M | 36.00M | 23.00M |
| Total revenue | 2362.62M | 2190.00M | 2191.00M | 2115.00M | 1865.00M |
| Total operating expenses | 1986.68M | 539.00M | 519.00M | 424.00M | 630.00M |
| Cost of revenue | 114.98M | 1460.00M | 1429.00M | 1516.00M | 1073.00M |
| Total other income expense net | -11.00M | 151.00M | 52.00M | -50.00M | -73.00M |
| Net income from continuing ops | 189.00M | 170.00M | 76.00M | 106.00M | 8.00M |
| Net income applicable to common shares | - | - | - | 103.00M | 5.00M |
| Breakdown | 2025-12-31 | 2024-12-31 | 2023-12-31 | 2022-12-31 | 2021-12-31 |
|---|---|---|---|---|---|
| Type | yearly | yearly | yearly | yearly | yearly |
| Date | 2025-12-31 | 2024-12-31 | 2023-12-31 | 2022-12-31 | 2021-12-31 |
| Total assets | 8175.67M | 6447.00M | 6206.00M | 5863.00M | 5450.00M |
| Intangible assets | 531.00M | 542.00M | 559.00M | 645.00M | 673.00M |
| Other current assets | 3341.39M | 2810.00M | 2384.00M | - | 278.00M |
| Total liab | 6137.01M | 4369.00M | 4141.00M | 3702.00M | 3472.00M |
| Total stockholder equity | 2019.67M | 2060.00M | 2048.00M | 2143.00M | 1961.00M |
| Other current liab | -35.00M | 3201.00M | 2859.00M | 2426.00M | 2040.00M |
| Common stock | 198.97M | 199.00M | 197.00M | 197.00M | 197.00M |
| Capital stock | 199.00M | 199.00M | 197.00M | 197.00M | 197.00M |
| Retained earnings | 2013.67M | 2910.00M | 2814.00M | 2800.00M | 2769.00M |
| Other liab | - | - | - | 179.00M | 199.00M |
| Good will | 1172.00M | 1159.00M | 1156.00M | 1232.00M | 1180.00M |
| Other assets | - | - | -3037.00M | 67.00M | 62.00M |
| Cash | 935.85M | 892.00M | 924.00M | 888.00M | 784.00M |
| Total current liabilities | 89.99M | 3352.00M | 3083.00M | 2488.00M | 2242.00M |
| Current deferred revenue | - | - | 2.00M | 2425.00M | 2033.00M |
| Net debt | 64.99M | 82.00M | 164.00M | 185.00M | 360.00M |
| Short term debt | 89.99M | 40.00M | 121.00M | 38.00M | 113.00M |
| Short long term debt | 58.00M | 9.00M | 93.00M | 9.00M | 77.00M |
| Short long term debt total | 1000.84M | 974.00M | 1088.00M | 1073.00M | 1144.00M |
| Other stockholder equity | -166.97M | -129.00M | -963.00M | -854.00M | -1005.00M |
| Property plant equipment | - | - | - | 275.00M | 310.00M |
| Total current assets | 5991.03M | 4397.00M | 4066.00M | 3524.00M | 3125.00M |
| Net tangible assets | - | - | - | 266.00M | 108.00M |
| Short term investments | 1313.79M | 331.00M | 758.00M | 438.00M | 273.00M |
| Net receivables | 400.00M | 364.00M | 2203.00M | 382.00M | 466.00M |
| Long term debt | 744.00M | 744.00M | 744.00M | 785.00M | 779.00M |
| Inventory | - | -364.00M | - | - | - |
| Accounts payable | 35.00M | 39.00M | 40.00M | 24.00M | 89.00M |
| Accumulated other comprehensive income | -26.00M | -920.00M | 32.00M | - | - |
| Non currrent assets other | 181.97M | 363.00M | 3085.00M | 980.00M | 636.00M |
| Non current assets total | 2184.65M | 2050.00M | 5177.00M | 2339.00M | 2325.00M |
| Capital lease obligations | 199.00M | 221.00M | 251.00M | 279.00M | 288.00M |
| Breakdown | 2025-12-31 | 2024-12-31 | 2023-12-31 | 2022-12-31 | 2021-12-31 |
|---|---|---|---|---|---|
| Type | yearly | yearly | yearly | yearly | yearly |
| Date | 2025-12-31 | 2024-12-31 | 2023-12-31 | 2022-12-31 | 2021-12-31 |
| Investments | -11.00M | -30.00M | 31.00M | -78.00M | 10.00M |
| Change to liabilities | - | - | - | 76.00M | -14.00M |
| Total cashflows from investing activities | -109.98M | -30.00M | 31.00M | -78.00M | -289.00M |
| Net borrowings | 18.00M | -76.00M | 39.00M | -76.00M | 43.00M |
| Total cash from financing activities | -263.96M | -277.00M | -130.00M | -163.00M | 296.00M |
| Change to operating activities | - | - | - | 10.00M | 13.00M |
| Net income | 230.00M | 214.00M | 74.00M | 163.00M | 97.00M |
| Change in cash | -55.81M | 47.00M | 131.00M | 121.00M | 118.00M |
| Begin period cash flow | 991.66M | 1019.00M | 888.00M | 767.00M | 649.00M |
| End period cash flow | 935.85M | 1066.00M | 1019.00M | 888.00M | 767.00M |
| Total cash from operating activities | 246.96M | 353.00M | 270.00M | 324.00M | 111.00M |
| Issuance of capital stock | - | - | - | 0.00M | 315.00M |
| Depreciation | 114.98M | 114.00M | 117.00M | 127.00M | 128.00M |
| Other cashflows from investing activities | 0.00M | 4.00M | 55.00M | 22.00M | 22.00M |
| Dividends paid | 128.00M | 115.00M | 100.00M | -78.00M | -47.00M |
| Change to account receivables | -86.99M | -13.00M | 69.00M | -24.00M | -16.00M |
| Sale purchase of stock | -123.98M | -56.00M | -36.00M | -3.00M | -2.00M |
| Other cashflows from financing activities | -29.98M | -30.00M | -4.00M | -35.00M | 235.00M |
| Change to netincome | - | - | - | 5.00M | 31.00M |
| Capital expenditures | 5.00M | 64.00M | 55.00M | 53.00M | 58.00M |
| Change in working capital | -127.98M | 79.00M | 84.00M | 89.00M | -53.00M |
| Stock based compensation | 49.00M | 33.00M | 17.00M | 13.00M | 10.00M |
| Other non cash items | -19.04M | -87.00M | -22.00M | -68.00M | -71.00M |
| Free cash flow | 241.96M | 289.00M | 215.00M | 271.00M | 53.00M |
Sector: Financial Services Industry: Capital Markets
|
Stock Name
|
Change
(USD) |
Price
(USD) |
Trailing
PE (x) |
Forward
PE (x) |
Price Sales
TTM (x) |
Price to Book Value (x)
|
Enterprise Value
to Revenue (x) |
Enterprise Value
to EBITDA (x) |
|---|---|---|---|---|---|---|---|---|
| TCAPF TP ICAP Group PLC |
- -% |
4.25 | 13.41 | 9.02 | 1.38 | 1.21 | 0.10 | 0.55 |
| GS Goldman Sachs Group Inc |
-15.55 1.74% |
875.99 | 17.21 | 16.00 | 4.47 | 2.26 | 11.15 | - |
| SCHW Charles Schwab Corp |
-1.29 1.39% |
91.65 | 19.53 | 13.89 | 7.16 | 4.22 | 8.80 | - |
| MS Morgan Stanley |
-2.58 1.39% |
182.99 | 16.50 | 13.76 | 2.80 | 1.65 | - | - |
| IBKR Interactive Brokers Group Inc |
-2.00 2.55% |
76.43 | 35.95 | 27.93 | 22.14 | 6.96 | 3.01 | 3.37 |
TP ICAP Group PLC provides intermediary services, contextual insights, trade execution, pre-trade and settlement services, and data-led solutions in Europe, the Middle East, Africa, the Americas, and the Asia Pacific. It operates through Global Broking, Energy & Commodities, Liquidnet, and Parameta Solutions divisions. The Global Broking division operates in rates, foreign exchange (FX) and money markets, equities, and credit products; and offers broking, facilitating price discovery, and liquidity services. The Energy & Commodities division operates in various commodities markets, including oil, gas, power, renewables, ferrous metals, base metals, precious metals, soft commodities, and digital assets. This division also assists in canvassing the market for expressions of interest, intelligence gathering, negotiations, and post-transaction processing; and provides insights on the impact of unpredictable factors, such as weather conditions, geopolitics, and exchange rate movements. The Liquidnet division operates Liquidnet, a cash equities dark/block electronic trading network; and Coex Partners, a trade advisory and agency execution service that covers listed derivatives, FX, government bonds, cleared interest rate swaps, and cash equities. This division serves hedge funds, asset managers, and asset owners. The Parameta Solutions division provides unbiased data products that facilitate trading, enhance transparency, reduce risk, and enhance operational efficiency; and pricing, reference data, and analytical tools . This division also offers real-time price information for the OTC financial and commodity markets delivering independent data for various asset classes, including rates, FX and money markets, volatility, oil, energy, inflation, credit, and equities. TP ICAP Group PLC is based in Saint Helier, Jersey.
| Name | Title | Year Born |
|---|---|---|
| Mr. Nicolas Noel Andre Breteau | Group CEO & Exec. Director | 1968 |
| Mr. Robin James Stewart | Group CFO & Exec. Director | 1967 |
| Mr. Philip Price | Group Gen. Counsel & Exec. Director | 1965 |
| Mr. Martin John Ryan | Group Chief Operating Officer | NA |
| Mr. Dominic Lagan | Head of Investor Relations | NA |
| Mr. Amir Zaidi | Global Head of Compliance | NA |
| Mr. William Baldwin-Charles | Group Media Relations & Internal Communications Director | NA |
| Richard Newman | Group Head of Marketing & Communications | NA |
| Ms. Susan Maple | Group Head of HR | NA |
| Mr. Nick Deflora | Chief Exec. Officer of ICAP Americas and Deputy Chief Exec. Officer of TP ICAP Americas | NA |
Disclaimer - (*)This information, including any data, is sourced from Unicorn Data Services SAS, trading as EOD Historical Data (“EODHD”) on an ‘as is’ basis, using their API. We cannot guarantee the completeness or validity of the information and data provided on this page, as well as via the API. In some cases, the data may include analyst ratings or recommendations sourced through the EODHD API, which are intended solely for general information purposes.
This information does not consider your personal objectives, financial situation, or needs. Kalkine is not liable for any errors or omissions in the information provided or for any actions taken in reliance on it. You should seek advice from a financial adviser, stockbroker or other professional adviser (including taxation and legal advice) as necessary before acting on this information.

Download a free report with stock ideas and industry insights for general information.
Download Free Report Now →


Basic Materials
 -0.44%
Communication Services
-0.67%

Consumer Cyclical
-0.51%

Consumer Defensive
-0.25%

Energy
-0.53%

Financial Services
-0.68%
Financials
-1.31%

Healthcare
-0.50%

Industrials
-0.60%

Real Estate
-0.34%

Technology
-1.10%

Utilities
-0.41%
Note: Daily price change (%) by sector excluding stocks with +/-90% daily price change. Companies above $500 million market capitalization are considered.
 Portfolio
 Watchlist


 +155.35%
 Please wait processing your request...