
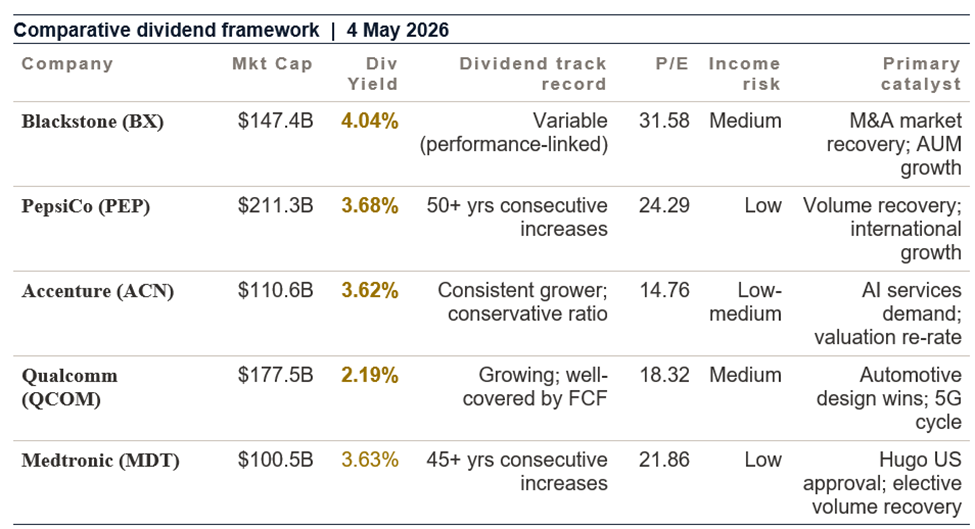
Blackstone, PepsiCo, Accenture, Qualcomm and Medtronic: five high-quality dividend stocks across alternative assets, consumer staples, IT services, semiconductors and medical devices. Yields up to 4%, decades of dividend history and risk analysis for the 2026 income investor
OVERVIEW
Five dividend stocks across five sectors: the 2026 US income investor's guide
In a world of elevated equity valuations, persistent inflation, and geopolitical uncertainty, the case for high-quality dividend stocks has rarely been stronger. These five companies -- spanning alternative asset management, consumer beverages, IT services, semiconductor technology and medical devices -- offer dividend yields from 2.19 per cent to 4.04 per cent, backed by some of the world's most durable business franchises.
What unites these five companies is not their sector but their quality. Each is a global leader in its field; each generates substantial free cash flow that comfortably funds its dividend; and each has a track record of maintaining or growing its distribution through economic cycles. For the income investor, quality of the earnings base -- not yield alone -- determines whether the dividend will still be paid in three, five and ten years' time.
The market data tells a nuanced story. On 4 May 2026, four of the five stocks declined: Qualcomm's -4.89 per cent was the largest move, driven by earnings-related news. PepsiCo fell -1.79 per cent. Blackstone was down -1.68 per cent. Medtronic slid -2.12 per cent. Only Accenture (+0.16 per cent) closed positive. These daily moves are noise relative to the multi-year dividend income thesis -- but they illustrate the reality that even the highest-quality dividend stocks carry short-term price risk.
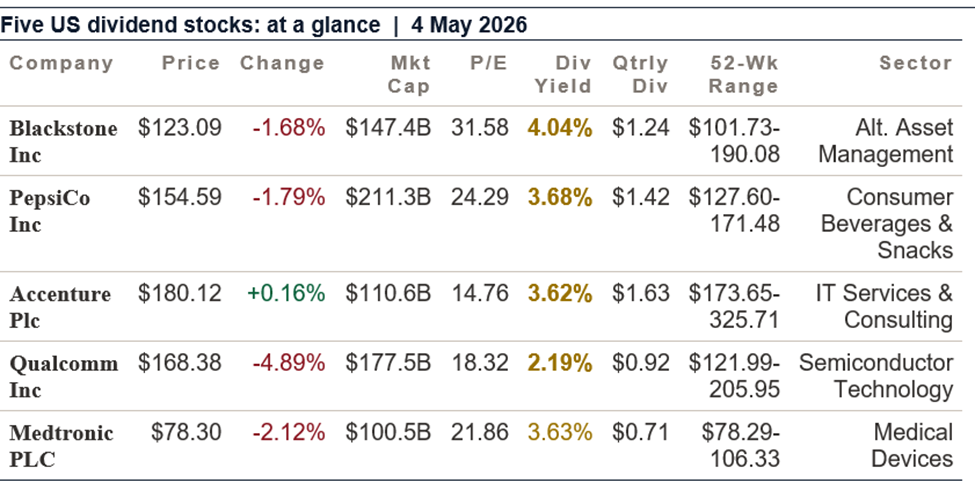
Source: EODHD, 4 May 2026.
|
|
Business Analysis |
What Blackstone does: Blackstone Inc is the world's largest alternative asset manager, managing approximately $1.1 trillion in assets across private equity, real estate, hedge fund solutions, credit and insurance. Founded in 1985 by Stephen Schwarzman and Peter Peterson, Blackstone has built the most recognisable brand in alternative investments -- a position it exploits through fundraising advantages, deal sourcing and talent acquisition that smaller competitors cannot match.
The alternative asset management model: Blackstone earns revenue through management fees (charged annually as a percentage of assets under management) and performance revenues (carried interest -- a share of investment profits above a hurdle rate, and realised performance fees). Management fees provide a stable, growing base; carried interest is variable and can be exceptional in strong exit markets. Blackstone's perpetual capital vehicles (insurance and perpetual private equity structures) have been growing rapidly, providing more stable, annuity-like revenue streams.
Real estate -- the historic backbone: Blackstone's real estate business is the world's largest private real estate fund manager, with approximately $300 billion under management. The firm has been a defining force in institutional real estate investment -- its BREIT (Blackstone Real Estate Income Trust) product brought private real estate to retail investors at scale. The real estate platform spans logistics, rental housing, hotels, office and data centres globally.
Private equity and credit: Blackstone's private equity business has delivered returns consistently above public market benchmarks over decades. The credit business -- spanning hedge funds, direct lending and insurance solutions -- has grown substantially as Blackstone has expanded beyond traditional leveraged buyouts into broader capital markets activity. The insurance platform, managing assets for insurance companies seeking higher returns, is among the firm's fastest-growing channels.
|
|
Dividend Analysis and Sustainability |
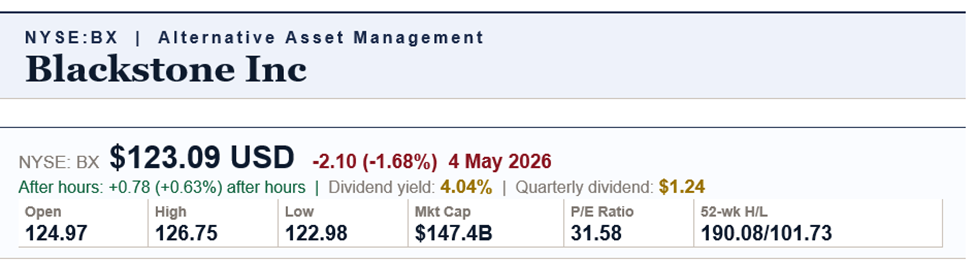
The Blackstone dividend model: Blackstone's dividend structure differs from conventional corporate dividends. As a publicly traded partnership (now treated as a corporation following its 2019 conversion), Blackstone distributes a variable dividend based on distributable earnings -- the cash generated by the business after management expenses but before non-cash charges. In strong performance years, distributions can be substantially higher than the base level; in weaker years, the distribution is lower. The 4.04 per cent yield and $1.24 quarterly distribution shown in EODHD reflects recent declared distributions.
The key driver of Blackstone's distributable earnings is realisation activity -- when Blackstone sells portfolio companies or real estate assets at gains, carried interest is recognised and distributed. In a strong M&A and exit environment, Blackstone's distributions rise substantially. In slower exit markets, they moderate. The 4.04 per cent yield on a $123.09 share price implies approximately $4.97 in annualised distributions -- a level that depends on continued portfolio monetisation activity.
The 52-week range of $101.73 to $190.08 is exceptionally wide -- an 87 per cent range that reflects the market's sensitivity to changing expectations about private market exit volumes and interest rate impacts on leveraged buyout economics. At $123.09, the stock is at the lower third of its 52-week range, suggesting investor concern about the pace of portfolio realisations and the outlook for private equity exits.
|
|
Financial Analysis |
Blackstone's P/E of 31.58 appears elevated for an asset manager, but reflects GAAP accounting for carried interest (which recognises unrealised gains but not their associated distributions). On a fee-related earnings basis -- excluding performance-related revenues -- Blackstone's valuation appears more reasonable relative to the growth in its management fee base. The management fee business is highly predictable and growing as AUM expands. Distributable earnings -- the metric most relevant to dividend sustainability -- are directly tied to transaction activity.
The company's balance sheet is strong, with significant own-account investment in its funds and substantial liquidity. Blackstone has consistently grown its AUM at double-digit rates, adding fee-paying capital from institutional and retail channels globally. The retail channel -- BREIT and its private equity equivalents -- represents a particularly large long-term growth opportunity as wealth managers expand client allocations to alternatives.
|
|
Price Performance |
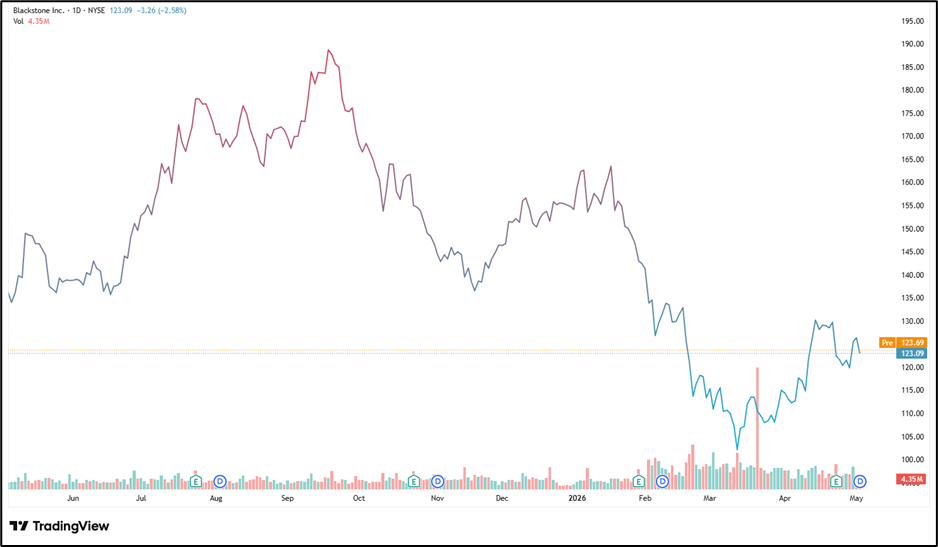
The -1.68 per cent decline on 4 May 2026 (from $124.97 open to $123.09 close) continues a significant derating from the $190.08 52-week high. The $190 level reflected peak optimism about private equity exit volumes and rate-cut driven enthusiasm for private market valuations. The subsequent decline to the $123 area reflects tighter credit conditions, slower M&A volumes, and recalibration of distributable earnings expectations. The after-hours recovery to $123.87 (+0.63%) is modest.
|
|
Outlook and Risks |
Blackstone's medium-term outlook is constructive. The secular shift of institutional and retail capital toward alternatives -- driven by return-seeking pension funds, insurance companies and wealth management clients -- provides a durable AUM growth tailwind. When M&A markets reopen and private equity exit volumes normalise, Blackstone's distributable earnings and distributions will increase.
Key risks: Variable dividend -- the 4.04% yield is not a fixed commitment. Realisation activity depends on M&A markets, which can be closed for extended periods. Interest rate risk -- leveraged buyout economics are sensitive to credit costs. Real estate cycle risk -- BREIT's performance affects both the investment returns and the retail distribution channel. Regulatory risk for alternative asset managers as the SEC increases oversight of private funds.
|
|
FAQs -- Blackstone Inc |
Q: Why is Blackstone's dividend variable?
A: Blackstone's distributions are based on distributable earnings -- actual cash generated, including carried interest from portfolio exits. In active exit years, distributions are higher; in slower markets, lower. It is not a fixed-commitment dividend.
Q: What is carried interest?
A: A share of investment profits above a hurdle rate, paid to the fund manager. Blackstone retains approximately 20% of investment profits for its own account (carried interest). When portfolio companies or real estate assets are sold at gains, this carried interest is realised and flows into distributable earnings.
Q: Why is the share price so far from its 52-week high?
A: At $123.09 versus $190.08 high, the stock has fallen ~35%. This reflects slower private equity exit volumes, higher interest rates increasing LBO cost of capital, and recalibrated distribution expectations.
|
|
Business Analysis |
What PepsiCo does: PepsiCo Inc is one of the world's largest food and beverage companies, generating approximately $90 billion in annual net revenue from a portfolio of iconic brands including Pepsi-Cola, Mountain Dew, Gatorade, Lay's, Doritos, Cheetos, Quaker Oats and many others. The company operates globally through seven reporting segments: Frito-Lay North America, Quaker Foods North America, PepsiCo Beverages North America, Latin America, Europe, Africa/Middle East/South Asia, and Asia Pacific Australia/New Zealand & China Region.
The dual-portfolio advantage: PepsiCo's combination of a world-class beverage portfolio and the world's largest convenient snacking franchise (Frito-Lay) is a structural advantage that competitors cannot replicate. Frito-Lay North America alone generates EBIT margins exceeding 25 per cent and is the undisputed leader in the US salty snack category. The snacks and beverages businesses complement each other across consumer occasions, retail shelf space and distribution logistics.
Pricing power and inflation management: PepsiCo is one of the clearest demonstrations of consumer brand pricing power in the global economy. During the 2022-2024 inflation cycle, PepsiCo successfully implemented cumulative price increases well above cost inflation, expanding margins while volumes declined modestly. The ability to raise prices without permanently losing customers is the core test of a consumer brand's moat -- PepsiCo passed it.
Dividend Aristocrat status: PepsiCo has increased its annual dividend for over 50 consecutive years, earning it status as a Dividend King -- among the most exclusive company of consistent dividend growers in the S&P 500. The $1.42 quarterly distribution ($5.68 annualised) has been increased consistently regardless of market conditions, making it one of the most reliable income streams in US equities.
|
|
Dividend Analysis and Sustainability |
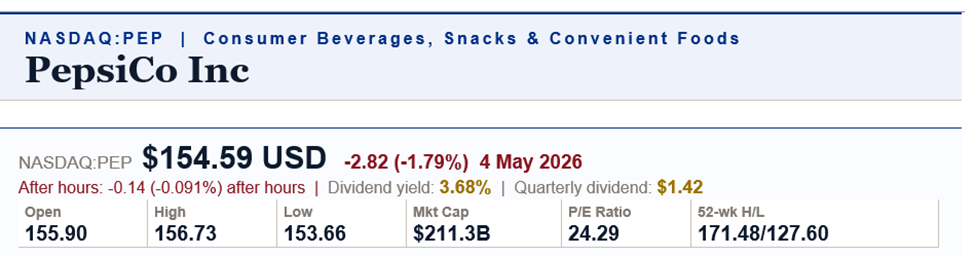
PepsiCo's 3.68 per cent dividend yield on a $154.59 price represents one of the highest yields the stock has offered in years -- a product of the share price declining from $171.48 (52-week high) while dividends have continued to grow. The $1.42 quarterly dividend ($5.68 annualised) is backed by approximately $7-8 billion in annual free cash flow, providing a payout ratio well within comfortable bounds.
The sustainability of PepsiCo's dividend is among the highest of any company in this article. Fifty-plus consecutive years of increases through multiple recessions, commodity cycles and the COVID-19 pandemic demonstrate a commitment to the dividend that is embedded in the company's corporate identity. Management has been explicit: dividend growth is a capital allocation priority alongside share repurchases.
The 52-week range of $127.60 to $171.48 -- with the current $154.59 in the lower half -- reflects investor concern about volume pressure as consumers trade down or reduce snack and beverage consumption in response to price increases. This volume-price tension is the central investment debate for PepsiCo in 2026: prices have been raised substantially; volumes need to recover for the growth story to re-accelerate.
|
|
Financial Analysis |
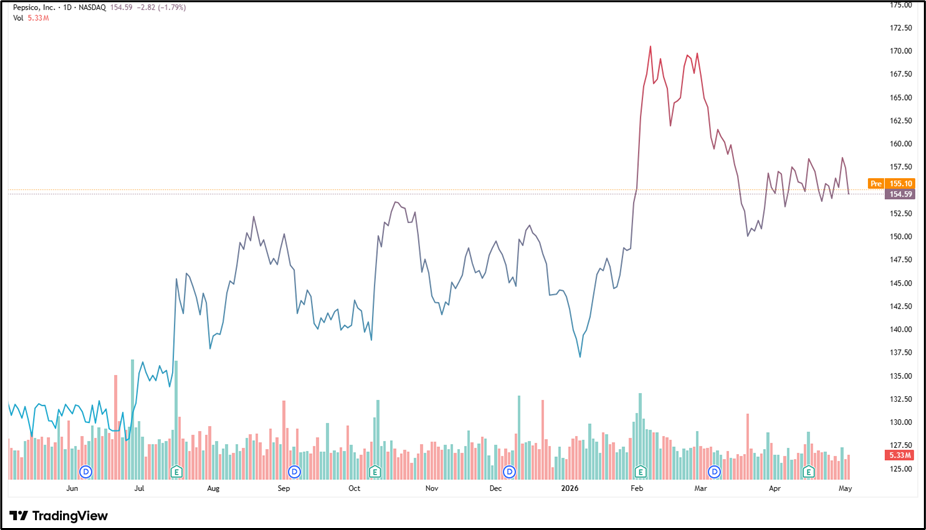
PepsiCo's P/E of 24.29 is a modest premium to the S&P 500 average, reflecting the quality premium investors assign to the most consistent dividend growers. At approximately $90 billion in net revenue and a disciplined cost structure, PepsiCo generates substantial and predictable earnings. The -1.79 per cent decline on 4 May 2026 -- on no specific news -- likely reflects broad market sentiment around consumer staples in a higher interest rate environment (where their bond-like income characteristics become relatively less attractive).
|
|
Outlook and Risks |
PepsiCo's outlook is cautiously positive. Volume recovery as the price cycle normalises, continued international growth (particularly in emerging markets where PepsiCo brands are gaining share), and innovation in health-oriented snacking categories provide growth levers. The dividend will be increased again -- the question is the magnitude, not the direction.
Key risks: Consumer volume elasticity -- if price increases have permanently reduced snack and beverage volumes, the growth model is challenged. GLP-1 weight-loss drug adoption risk -- a widely discussed but not yet clearly quantified risk that widespread GLP-1 usage could reduce consumer appetite for high-calorie snacks and beverages. Commodity cost inflation. International currency headwinds.
|
|
FAQs -- PepsiCo |
Q: Why is PepsiCo a Dividend King?
A: PepsiCo has increased its annual dividend for over 50 consecutive years -- a record that includes multiple recessions, the 2008 financial crisis and the COVID-19 pandemic. This qualifies it as a 'Dividend King' (50+ years of consecutive increases).
Q: How does PepsiCo's snack business compare to its beverages?
A: Frito-Lay North America (snacks: Lay's, Doritos, Cheetos) is actually PepsiCo's highest-margin segment, with EBIT margins exceeding 25%. The beverages segment (Pepsi, Gatorade, Mountain Dew) is larger by volume but lower in margin. Together they create a uniquely diversified consumer franchise.
Q: What is the GLP-1 risk to PepsiCo?
A: GLP-1 drugs (like Ozempic) reduce appetite. Some analysts argue widespread adoption could reduce demand for high-calorie snacks and beverages, impacting PepsiCo's volumes. PepsiCo management has responded by accelerating its healthier product portfolio. The actual magnitude of this risk remains uncertain and actively debated.
|
|
Business Analysis |
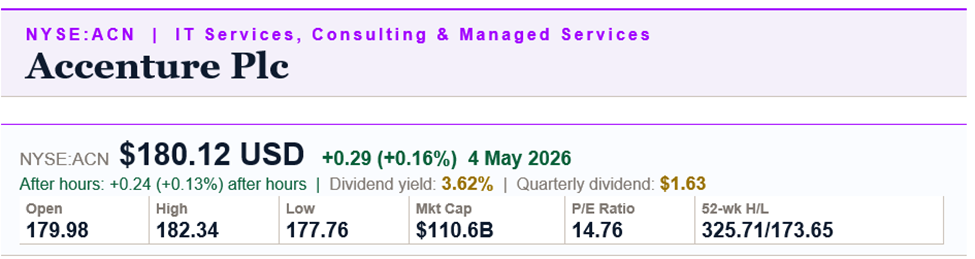
What Accenture does: Accenture Plc is a global professional services company providing strategy and consulting, technology, and operations services to clients across more than 120 countries. With approximately 750,000 employees and revenues of approximately $65 billion annually, Accenture is the world's largest IT services and consulting firm. The company works with clients to transform their operations using cloud computing, artificial intelligence, data analytics, cybersecurity and enterprise software.
The AI services opportunity: Accenture has positioned itself at the centre of the enterprise AI adoption wave. Every large company implementing AI -- for customer service, supply chain, product development, risk management or process automation -- requires consulting expertise and technology implementation capability. Accenture's 'AI at scale' strategy targets the multi-year engagement revenue from helping Fortune 500 companies build and deploy AI systems across their operations. AI bookings have grown rapidly and represent a material portion of new contract wins.
Managed services and recurring revenue: Beyond project-based consulting, Accenture operates a significant managed services business where it runs technology functions on behalf of clients on multi-year contracts. This managed services segment provides recurring, contracted revenue that reduces Accenture's dependence on the project consulting cycle and provides earnings stability. Long-term managed services contracts are particularly valuable because switching costs are high -- replacing an embedded technology services provider is complex and disruptive.
The 52-week high of $325.71: The current $180.12 price is 45 per cent below the 52-week high of $325.71. This dramatic decline reflects a significant IT services sector re-rating driven by concerns about AI disrupting consulting demand -- the paradox that the same AI that Accenture sells services to implement may ultimately reduce the number of consultants and technologists needed. This paradox has weighed heavily on IT services stocks across the sector in 2025-2026.
|
|
Dividend Analysis and Sustainability |
Accenture's 3.62 per cent yield at $180.12 (quarterly $1.63, annualised $6.52) is one of the most attractive yields the stock has offered in its history as a dividend payer. The yield has risen as the share price has fallen -- not because the dividend has been cut. Accenture has been a consistent grower of its semi-annual dividend and has been using share buybacks alongside dividends as its capital return tools.
The dividend sustainability is strong: Accenture generates approximately $8-9 billion in annual operating cash flow against an annualised dividend commitment of approximately $4-5 billion. The payout ratio is conservative, and the company's earnings are well-diversified across geographies, industries and service lines. No single client accounts for more than 3 per cent of revenues, minimising concentration risk in the earnings base.
|
|
Financial Analysis |
Accenture's P/E of 14.76 is remarkably low for a company that has historically traded at 25-30x earnings. The re-rating from the $325.71 high to the $180.12 current price has compressed the P/E dramatically. If the market's AI-displacement fear is overdone -- if Accenture's positioning in AI services delivery actually accelerates revenue rather than destroying it -- then the current 14.76x P/E represents a significant value opportunity in a high-quality dividend-growing franchise.
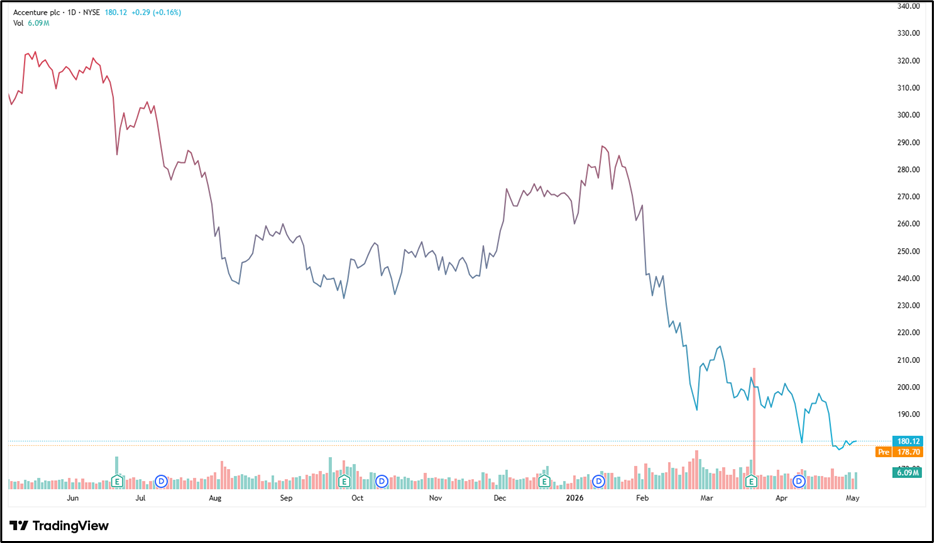
The +0.16 per cent positive close on 4 May 2026 -- the only positive mover of the five -- suggests Accenture is attracting selective buying even as peers decline. The after-hours continuation (+0.24/+0.13%) reinforces this positive near-term sentiment.
|
|
Outlook and Risks |
Accenture's outlook is the most debated of the five. The AI opportunity is massive -- and Accenture is spending heavily to capture it (over $3 billion in AI-related acquisitions and investments). If enterprise AI adoption runs at the pace that hyperscalers and enterprise software companies are projecting, Accenture's AI practice could be one of the most valuable professional services franchises in the world within five years.
Key risks: AI displacement of consulting demand -- the fundamental bear case. If AI tools can replicate 30-50 per cent of what consultants do, IT services firms face structural revenue challenges. Consulting cycle sensitivity -- in economic downturns, clients cut discretionary IT spending faster than other costs. Federal government consulting revenue risk -- Accenture has substantial US government contract exposure. The 45% share price decline from highs suggests the market has already priced in significant AI risk.
|
|
FAQs -- Accenture |
Q: Why has Accenture's share price fallen so far from its 52-week high?
A: At $180.12 versus $325.71 high, the stock is down ~45%. This reflects a sector-wide re-rating of IT consulting stocks on fears that AI will reduce enterprise demand for human consultants and technology implementers. Whether this fear is justified or overdone is the central Accenture investment debate.
Q: How is Accenture positioned for AI?
A: As a major AI services provider -- helping enterprise clients implement AI in their operations. Accenture has made over $3B in AI investments and acquisitions. The bull case: Accenture sells the implementation services every company needs to actually use AI. The bear case: AI eventually replaces many of those services.
Q: Is Accenture's dividend at risk?
A: The 3.62% yield is elevated because the share price has fallen, not because the dividend has been cut. With $8-9B in annual operating cash flow and a conservative payout ratio, the dividend has strong cash flow coverage.
|
|
Business Analysis |
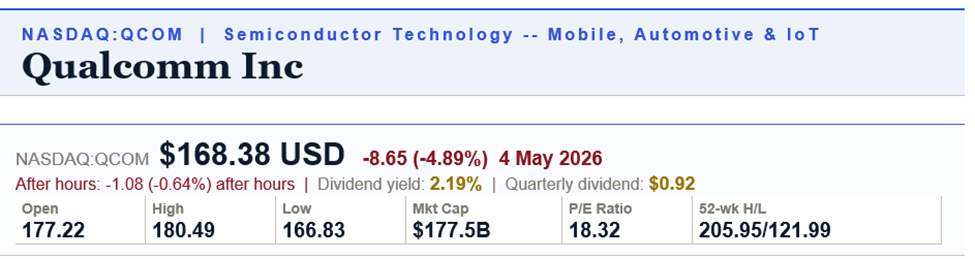
What Qualcomm does: Qualcomm Incorporated is a global semiconductor and technology company best known for the Snapdragon system-on-chip (SoC) platform that powers the majority of the world's premium Android smartphones. Beyond mobile, Qualcomm has been diversifying into automotive (the Snapdragon Digital Chassis), Internet of Things (industrial, consumer and edge computing devices), and PC computing. Qualcomm's technology is present in billions of devices globally.
The Snapdragon ecosystem: Snapdragon is Qualcomm's primary chip brand, encompassing application processors, modems, connectivity chips (Wi-Fi, Bluetooth, ultra-wideband) and AI accelerators integrated into a single SoC. The Snapdragon platform is used by Samsung, Xiaomi, Oppo, Sony and many other Android device makers. Qualcomm holds a dominant market position in the premium Android SoC market -- a position that generates high margins and creates switching costs as device makers integrate deeply with the platform.
Qualcomm Technology Licensing (QTL): Separate from its chip business, Qualcomm's licensing division (QTL) licenses fundamental wireless communications patents to handset makers globally. This licensing revenue -- typically 3-5 per cent of the selling price of mobile devices -- is highly profitable (margins approaching 70-80 per cent), requires minimal capital, and is effectively mandatory for any company selling 3G, 4G or 5G devices. QTL is among the most valuable IP licensing businesses in the global technology industry.
Automotive diversification: Qualcomm's automotive design win pipeline has grown from approximately $19 billion in FY2022 to substantially higher levels as car manufacturers commit to Snapdragon Digital Chassis for in-car computing, connectivity and ADAS. These design wins convert to production revenue over 3-5 year development and ramp cycles, providing long-duration revenue visibility in a market where semiconductor content per vehicle is growing rapidly.
|
|
Dividend Analysis and Sustainability |
Qualcomm's 2.19 per cent yield is the lowest of the five stocks, reflecting the company's orientation toward growth (stock buybacks have been the larger capital return mechanism) alongside a steadily growing cash dividend. The $0.92 quarterly dividend ($3.68 annualised) has been increased consistently, but at a lower yield relative to price than the other four stocks because Qualcomm's stock price has performed strongly over the long term (the 52-week high was $205.95).
The dividend is very well covered. Qualcomm generates approximately $10-11 billion in annual free cash flow, of which dividends represent approximately $4 billion -- a payout ratio below 40 per cent. The balance is deployed in share buybacks, which have been substantial and value-accretive at current P/E multiples.
|
|
Financial Analysis |
Qualcomm's P/E of 18.32 is modest for a technology company with its IP licensing moat, automotive growth trajectory and dominant position in premium smartphone semiconductors. The earnings yield of approximately 5.5 per cent at 18.32x compares very favourably with other semiconductor companies. The company's earnings are somewhat cyclical -- tied to global smartphone unit sales and the pace of handset upgrades -- but the QTL licensing base provides a more stable floor.
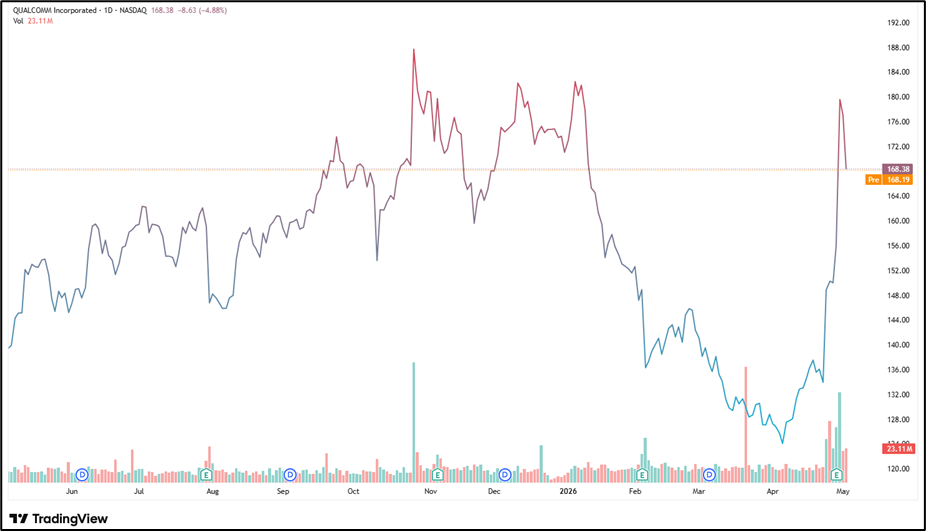
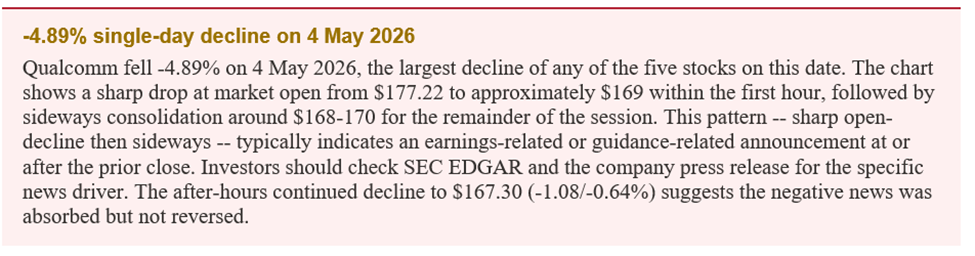
The -4.89 per cent decline on 4 May 2026 likely reflects earnings results or guidance. Investors should review the specific earnings release for context -- the decline pattern (sharp open, then consolidation) is characteristic of an earnings disappointment rather than a broader market move. The stock's proximity to the $166.83 intraday low (near the session's bottom at close) suggests limited buying at the current level.
|
|
Outlook and Risks |
Qualcomm's medium-term outlook is positive but nuanced. The automotive semiconductor opportunity is the most durable long-term growth driver -- design win conversions into revenue will compound over the next 5-10 years. Smartphone recovery in China (a major Qualcomm market) and the next 5G upgrade cycle support the handset business. AI integration into edge devices -- requiring more powerful on-device processing that plays to Qualcomm's Snapdragon AI capabilities -- is an additional growth catalyst.
Key risks: Apple has been developing its own modem chip (C1 modem, expected to replace Qualcomm in iPhones progressively from 2025-2027) -- this is the single most discussed bear case risk for Qualcomm. Loss of Apple modem revenue would be a material earnings headwind. China market risk -- Qualcomm derives significant revenue from Chinese smartphone makers; trade tensions or local chip substitution could reduce this. QTL licensing disputes -- Qualcomm has faced repeated antitrust challenges to its licensing model from regulators and device makers globally.
|
|
FAQs -- Qualcomm |
Q: Why did QCOM fall -4.89% on 4 May 2026?
A: The sharp open-decline pattern suggests an earnings-related announcement at or after the prior close. Investors should check Qualcomm's Q2 FY2025 earnings release and guidance on SEC EDGAR for the specific explanation. The after-hours continued decline suggests the market was absorbing disappointing news.
Q: What is QTL and why is it important?
A: Qualcomm Technology Licensing licenses Qualcomm's fundamental wireless (3G/4G/5G) patents to handset manufacturers globally. This segment generates ~70-80% margins with minimal capital requirements. It is one of the most profitable technology businesses globally.
Q: What is the Apple modem risk?
A: Apple has been developing its own cellular modem chip (the C1, launched in iPhone 16e) to replace Qualcomm modems in iPhones. If Apple successfully reduces its Qualcomm modem reliance across its product line, Qualcomm loses a major customer. However, Qualcomm still earns QTL patent licensing from Apple regardless of which modem is used.
|
|
Business Analysis |
What Medtronic does: Medtronic PLC is the world's largest standalone medical device company, designing, manufacturing and commercialising technology-based healthcare products and therapies across four business groups: Cardiovascular, Medical Surgical, Neuroscience and Diabetes. The company operates in more than 150 countries and generates approximately $32 billion in annual revenue from products including cardiac pacemakers, defibrillators, insulin pumps, robotic surgical systems and spinal stimulators.
Cardiovascular -- the largest segment: Medtronic's cardiovascular portfolio includes cardiac rhythm management (pacemakers, implantable defibrillators), structural heart therapies (transcatheter aortic valve replacement -- TAVR), cardiac surgery and peripheral vascular products. The TAVR market, where Medtronic competes with Edwards Lifesciences and Abbott, is a particularly important growth segment as the procedure expands from high-surgical-risk patients to lower-risk populations.
Surgical robotics -- the growth bet: Medtronic's Hugo robotic surgical system is the company's response to Intuitive Surgical's dominance in robotic-assisted surgery. Hugo is in commercial launch in international markets and undergoing US FDA regulatory review. A successful US launch would be a major growth catalyst -- the US is the world's largest surgical robotics market and Intuitive's $16 billion market cap demonstrates the value creation potential in this segment.
Diabetes -- pump and CGM: Medtronic's diabetes segment manufactures insulin pumps (the MiniMed series) and continuous glucose monitoring (CGM) systems. The diabetes segment has been challenged by competition from Dexcom (CGM) and Tandem Diabetes Care (pumps), but Medtronic has been investing in its next-generation Simplera CGM and MiniMed 780G automated insulin delivery system.
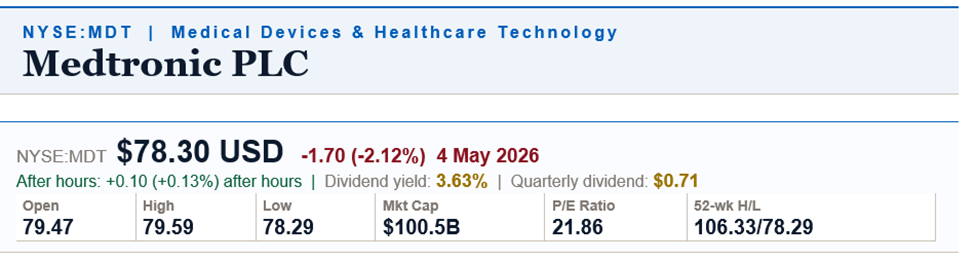
Dividend Aristocrat: Medtronic has increased its annual dividend for over 45 consecutive years -- a track record that spans multiple device market cycles, regulatory challenges and the COVID-19 pandemic's dramatic reduction in elective procedures. The quarterly $0.71 dividend ($2.84 annualised) represents a 3.63 per cent yield at $78.30 -- one of the more attractive yields available in high-quality medical device companies.
|
|
Dividend Analysis and Sustainability |
Medtronic's dividend sustainability is excellent. The company generates approximately $5-6 billion in annual free cash flow against a dividend commitment of approximately $3.8 billion ($0.71 quarterly x 4 x ~1.35 billion shares). The payout ratio is approximately 60-65 per cent of free cash flow -- covered but not excessive. The 45+ year consecutive dividend increase record is among the longest in the S&P 500.
The stock's current position at $78.30 -- literally at its 52-week low (the screenshot shows the 52-week low as $78.29, essentially identical to the current close) -- creates an unusual income opportunity: the yield is at a multi-year high because the stock is at a multi-year low, while the dividend has continued to be paid and grown. This price-yield divergence is the classic income investor's setup.
|
|
Financial Analysis |
Medtronic's P/E of 21.86 is a slight premium to the broader market, reflecting the quality and defensiveness of its medical device franchise. At $78.30, the stock is well below the $106.33 52-week high -- a decline of approximately 26 per cent that reflects slower-than-expected recovery from COVID-related elective procedure disruptions, competitive pressures in diabetes devices, and delayed US approval timelines for Hugo surgical robotics.
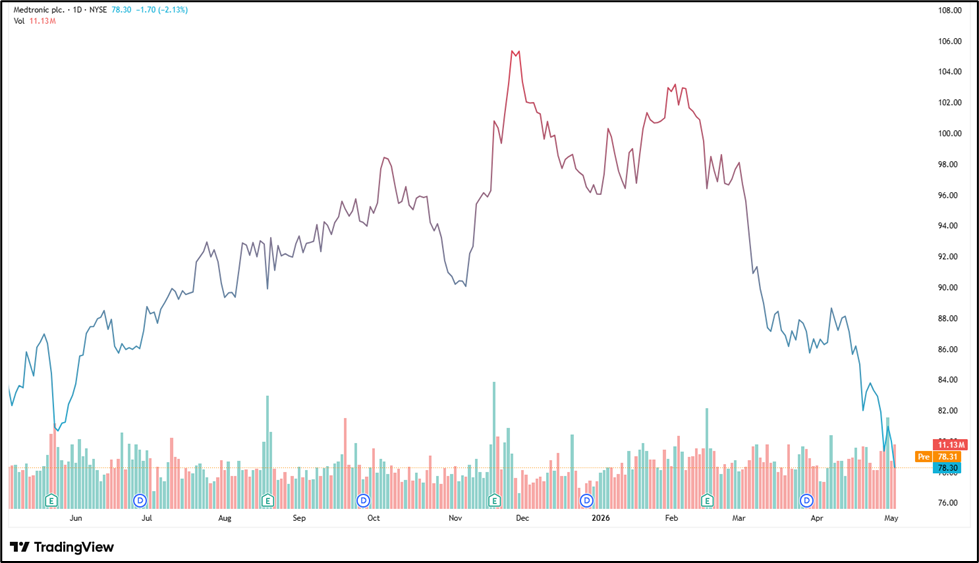
The -2.12 per cent decline on 4 May 2026 continues the broader downward trend. The intraday range of $78.29-$79.59 on a close of $78.30 -- with the close essentially at the intraday low -- reflects continued selling pressure with limited buying support. The after-hours recovery to $78.40 (+$0.10) is minimal.
|
|
Outlook and Risks |
Medtronic's outlook is one of gradual improvement rather than dramatic acceleration. The elective procedure volume recovery that was expected to drive strong top-line growth has been slower and more uneven than anticipated. Hugo surgical robotics' US FDA approval and launch represents the most significant potential positive catalyst -- success in surgical robotics would add a high-growth business to a portfolio otherwise dominated by steady but modest growers.
Key risks: Elective procedure volume sensitivity -- recessions reduce elective surgeries and device implants. Competition in structural heart (Edwards Lifesciences in TAVR), diabetes (Dexcom, Tandem) and potentially surgical robotics (Intuitive Surgical, Stryker Mako). Hugo US regulatory approval delay or rejection. Currency risk -- Medtronic reports in USD but earns significant revenue internationally. The current proximity to the 52-week low raises the question of whether there is more downside before stabilisation.
|
|
FAQs -- Medtronic |
Q: Why is Medtronic near its 52-week low?
A: At $78.30 close vs $78.29 52-week low, the stock is at its annual bottom. This reflects slower-than-expected organic growth recovery, competitive pressure in diabetes, and delays in Hugo surgical robotics US approval. For income investors, this proximity to the low creates one of the highest yield entry points in years.
Q: What is Hugo?
A: Medtronic's robotic surgical assistance system, competing with Intuitive Surgical's da Vinci. Hugo is commercially launched internationally and awaiting US FDA clearance. US launch would be a major growth catalyst for Medtronic's highest-growth potential product.
Q: Has Medtronic ever cut its dividend?
A: Medtronic has increased its annual dividend for 45+ consecutive years -- it has not cut its dividend in recent history. The commitment to progressive dividends is embedded in Medtronic's capital allocation identity.
COMPARATIVE ANALYSIS
Five dividend stocks compared: matching income profile to investor need
The five companies offer distinct income profiles: a variable-distribution alternative asset manager, a consumer staples Dividend King, an AI-repositioning IT services firm, a semiconductor IP licensor, and a world-class medical device franchise at a multi-year price low.
For the most reliable dividend income: PepsiCo and Medtronic both carry 45-50+ year dividend growth records. Between the two, PepsiCo offers higher geographic diversification and more predictable consumer demand; Medtronic offers higher growth potential from Hugo robotics at the cost of more near-term uncertainty. Both are appropriate anchors for an income portfolio.
For the highest absolute yield with variable income: Blackstone at 4.04 per cent offers the highest yield but with the most variable distribution. Investors who understand and accept the performance-linked distribution model -- and have conviction about private markets M&A recovery -- may find Blackstone's yield attractive. It is not appropriate for investors who need predictable quarterly income.
For the income-plus-value combination: Accenture at 14.76x P/E and 3.62 per cent yield is the most striking combination of low valuation and reliable income. If the AI displacement fears prove overdone, ACN offers both income and capital appreciation potential from a P/E re-rating. The 45% share price decline from the high makes the entry valuation the most attractive it has been in years.
For the tech-growth-plus-income combination: Qualcomm at 2.19 per cent offers the lowest yield but the highest technology growth optionality -- automotive chip design wins, on-device AI and the next 5G upgrade cycle. For income investors willing to accept a lower current yield in exchange for higher potential capital appreciation, Qualcomm is the natural choice.

_05_20_2026_22_15_04_838839.png)
_05_20_2026_15_03_17_853649.png)

 Please wait processing your request...