_05_05_2026_04_12_43_725650.jpg)
Quantum computing stocks IonQ, D-Wave Quantum, and Richtech Robotics are flashing early reversal signals after prolonged corrections. Technical analysis reveals base formations, improving momentum, and volume expansion across all three high-beta names — but can bulls sustain the breakout? Here's what the charts say.
Key Highlights
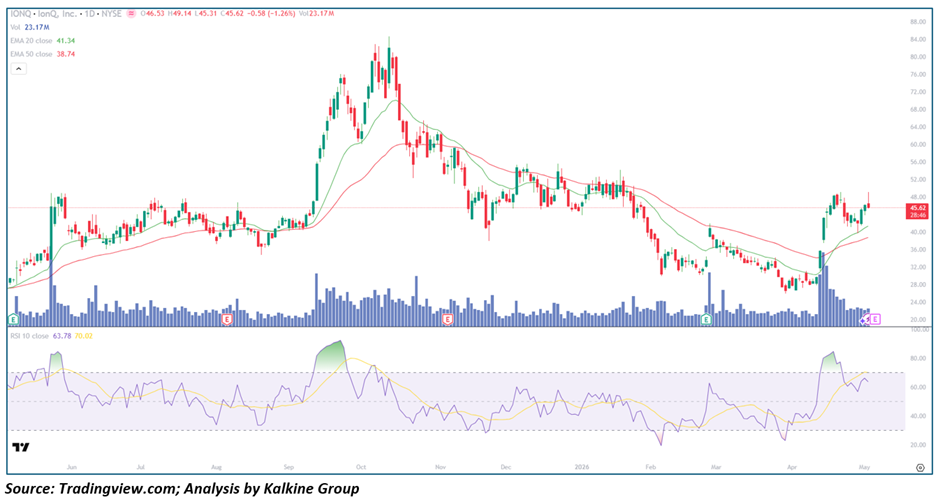
- IonQ Inc. (NYSE: IONQ) is trading near the 45–46 zone after a strong rebound from recent lows
• Price has moved back above the 20-day (~41.35) and is approaching the 50-day (~38.75) moving averages
• RSI near ~64 indicates strengthening momentum without being overbought
• Volume expanded during the recent upside move, confirming renewed participation
• Structure suggests bottom formation after a prolonged downtrend
Trend Structure: Early Reversal Formation
IONQ is transitioning from a downtrend into a potential recovery phase.
Key observations include:
• Prior sequence of lower highs and lower lows has slowed
• Formation of a rounded base structure
• Initial signs of higher lows emerging
This suggests:
• Selling pressure is weakening
• Buyers are gradually regaining control
• A potential trend reversal may be developing
The structure reflects a base-building phase within a broader corrective trend.
Price Action: Recovery with Controlled Strength
Recent price action shows improving sentiment:
- Strong bounce from the 30–32 demand zone
• Series of bullish candles with follow-through
• Price stabilizing above short-term support
This implies:
• Accumulation at lower levels
• Reduced downside volatility
• Early-stage bullish participation
Such action typically signals:
• Gradual upside continuation
• Attempt to reclaim key resistance levels
Moving Averages: Transition Phase
The moving average setup indicates a shift:
- Price has reclaimed the 20-day MA
• Price testing zone near the 50-day MA
• 20-day MA beginning to flatten
Interpretation:
• Short-term trend turning positive
• Medium-term trend still neutral
• Confirmation needed for sustained uptrend
Momentum Indicators: Strength Building
RSI is trending higher toward the 60–65 zone.
Key signals:
• Momentum improving steadily
• No extreme overbought conditions
• Positive slope in RSI
Interpretation:
• Buyers gaining strength
• Upside continuation possible
• Healthy momentum profile
Volume Analysis: Accumulation Signs
Volume behavior supports the move:
- Increased activity during recent rally
• Higher participation near breakout attempts
• No aggressive selling spikes
This indicates:
• Institutional accumulation possible
• Demand returning at lower levels
• Recovery has credibility
Market Structure: Base to Breakout Setup
The broader structure suggests:
- Downtrend transitioning into consolidation
• Base formation near key support
• Attempt to break into higher range
This combination suggests:
• Early bullish reversal potential
• Need for confirmation above resistance
• Volatility likely during transition
Key Technical Levels and Scenarios
Support Levels
- 42–40 as immediate support
• 38 as short-term support
• 32–30 as major base support
Resistance Levels
- 48–50 as immediate resistance
• 55 as next upside zone
• 65 as extended resistance
Scenarios
- Bullish Continuation (Primary Case)
• Price holds above 42
• Breakout above 50
• Momentum strengthens
• Move toward 55–65 - Consolidation (Secondary Case)
• Range between 40–50
• RSI stabilizes
• Base formation continues
• Gradual upward bias - Bearish Rejection (Low Probability)
• Failure near 50
• Drop below 40
• Retest of 32–35 zone
• Delay in reversal
Conclusion: Early Recovery with Breakout Potential
IonQ is showing early signs of recovery supported by improving momentum and volume expansion. While the broader trend remains in transition, sustained strength above key resistance levels could confirm a bullish reversal.
D-Wave Quantum Inc. Showing Base Breakout Attempt: Gradual Momentum Expansion Signals Trend Stabilization
Key Highlights
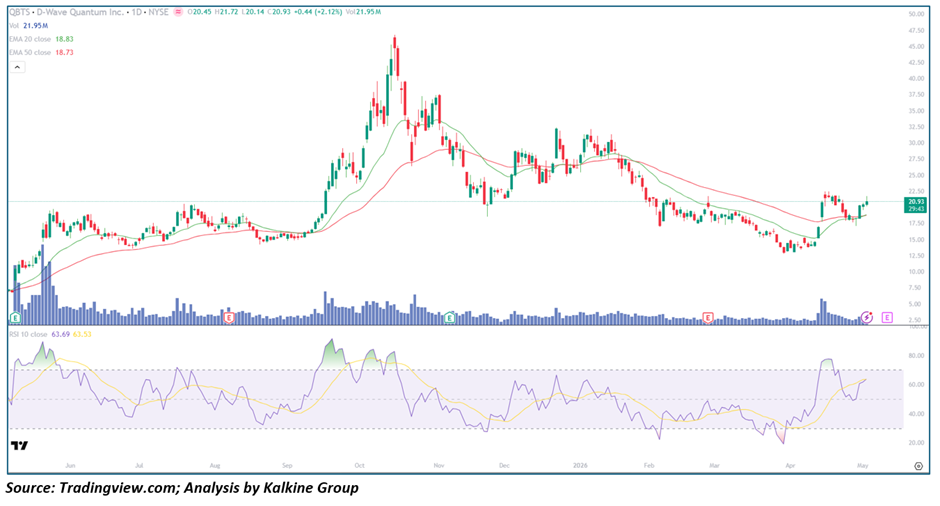
- QBTS is trading near the 20–21 zone after rebounding from recent lows
• Price has reclaimed both the 20-day (~18.83) and 50-day (~18.73) moving averages
• RSI near ~63 indicates strengthening momentum
• Volume shows moderate expansion during upside moves
• Structure suggests bottoming after extended correction
Trend Structure: Stabilization After Downtrend
QBTS is transitioning from weakness to stability.
Key observations include:
• Decline from prior highs has slowed
• Formation of a base structure near 15–17 zone
• Emerging higher lows
This suggests:
• Downtrend losing strength
• Buyers entering gradually
• Potential reversal forming
Price Action: Gradual Uptrend Development
Recent price behavior shows controlled strength:
- Steady climb from support levels
• Small bullish candles with consistency
• Limited volatility spikes
This implies:
• Healthy accumulation
• Sustainable momentum
• Reduced speculative excess
Moving Averages: Bullish Reclaim
The moving averages confirm improvement:
- Price above both short- and medium-term averages
• 20-day MA turning upward
• Early bullish crossover signals
Interpretation:
• Trend shifting bullish
• Stronger base support forming
• Pullbacks likely supported
Momentum Indicators: Strength Without Excess
RSI behavior remains constructive:
- RSI in 60–65 range
• No overbought conditions
• Gradual upward slope
Interpretation:
• Momentum sustainable
• Room for upside
• No immediate exhaustion
Volume Analysis: Moderate Confirmation
Volume trends indicate:
- Slight increase during rallies
• Balanced participation
• Lack of aggressive selling
This suggests:
• Stable accumulation
• Market confidence improving
• Controlled rally structure
Market Structure: Base Breakout Attempt
The broader setup reflects:
- Extended downtrend followed by consolidation
• Break above short-term resistance
• Attempt to establish new range
This combination suggests:
• Early bullish phase
• Potential continuation
• Need for follow-through
Key Technical Levels and Scenarios
Support Levels
- 19–18 as immediate support
• 17 as short-term support
• 15 as major base support
Resistance Levels
- 22–23 as immediate resistance
• 26 as next upside zone
• 30 as major resistance
Scenarios
- Bullish Continuation (Primary Case)
• Price sustains above 19
• Break above 23
• Momentum expands
• Rally toward 26–30 - Consolidation (Secondary Case)
• Range between 18–23
• Momentum stabilizes
• Base formation continues - Bearish Pullback (Low Probability)
• Drop below 18
• Weakness resumes
• Retest of 15
Conclusion: Controlled Recovery with Upside Potential
QBTS is showing a stable recovery supported by improving structure and momentum. A confirmed breakout above resistance could trigger a stronger bullish phase.
Richtech Robotics Inc. Showing Bottoming Structure: Weak Trend Stabilization with Gradual Recovery Signals
Key Highlights
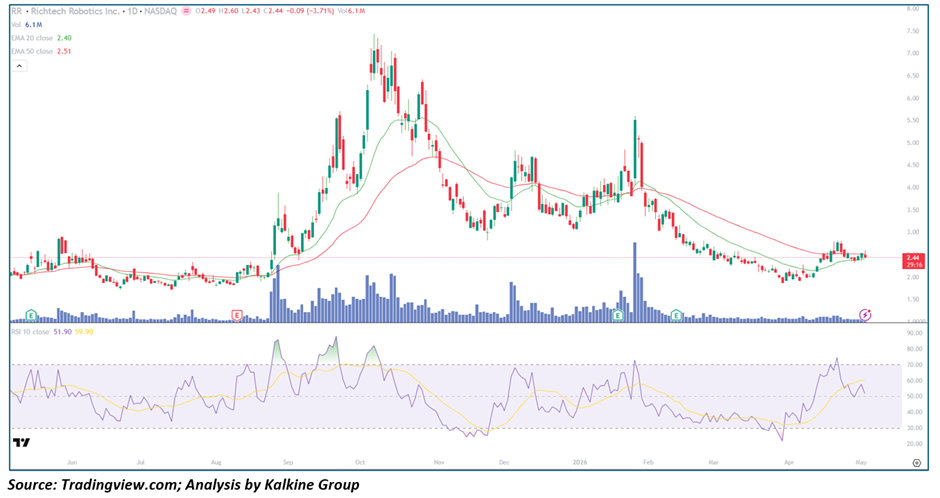
- RR is trading near the 2.4–2.5 zone after prolonged decline
• Price is hovering around the 20-day (~2.40) and below the 50-day (~2.51) moving averages
• RSI near ~51–55 indicates neutral momentum
• Volume remains relatively muted with occasional spikes
• Structure suggests long-term bottoming attempt
Trend Structure: Prolonged Downtrend Stabilizing
RR remains in a weak structure but shows stabilization.
Key observations include:
• Extended downtrend from previous highs
• Flattening price action near lows
• Absence of fresh breakdown
This suggests:
• Selling pressure fading
• Market entering accumulation phase
• Early base formation
Price Action: Sideways Consolidation
Recent price behavior highlights:
- Narrow trading range
• Lack of strong directional move
• Occasional bullish attempts
This implies:
• Indecision in market
• Balanced supply and demand
• Waiting for catalyst
Moving Averages: Neutral to Weak
The moving average structure shows:
- Price near 20-day MA
• Below 50-day MA
• Lack of strong trend direction
Interpretation:
• Trend still weak
• Early signs of stabilization
• Needs breakout confirmation
Momentum Indicators: Neutral Zone
RSI signals:
- RSI near mid-50s
• No strong momentum
• Slight improvement
Interpretation:
• Neutral momentum
• Potential for either direction
• Early recovery signs
Volume Analysis: Low Participation
Volume trends indicate:
- Generally low activity
• Occasional spikes
• Lack of sustained demand
This suggests:
• Weak conviction
• Early-stage accumulation
• Need for volume expansion
Market Structure: Bottom Formation
The broader structure reflects:
- Long-term decline
• Formation of base near lows
• Early consolidation phase
This combination suggests:
• Potential reversal base
• Slow recovery process
• High uncertainty
Key Technical Levels and Scenarios
Support Levels
- 2.30–2.20 as immediate support
• 2.00 as major support
Resistance Levels
- 2.60 as immediate resistance
• 3.00 as next upside zone
• 3.80 as major resistance
Scenarios
- Gradual Bullish Recovery (Primary Case)
• Price holds above 2.30
• Break above 2.60
• Move toward 3.00 - Consolidation (Secondary Case)
• Range between 2.20–2.60
• Low volatility continues - Bearish Breakdown (Risk Case)
• Drop below 2.20
• Weakness resumes
• New lows possible
Conclusion: Early Bottoming with Limited Momentum
Richtech Robotics is showing early signs of stabilization after a prolonged decline. While a base appears to be forming, stronger confirmation through volume and breakout is needed for a sustained bullish reversal.
Final Combined Conclusion: Early-Stage Recovery Across High-Beta Tech Plays
IonQ, D-Wave Quantum, and Richtech Robotics are exhibiting early-stage recovery or base formation patterns following extended corrections. While momentum is improving—especially in IONQ and QBTS—the broader structures remain in transition phases.
Key takeaways:
• IONQ shows the strongest recovery momentum
• QBTS displays stable and sustainable improvement
• RR remains weakest but is stabilizing
Overall, the group reflects increasing speculative interest, potential sector-wide recovery, and high volatility with breakout opportunities. As long as key support levels hold, these stocks could transition into stronger bullish phases, though confirmation through breakouts and volume expansion remains critical.


 Please wait processing your request...