
Wheaton Precious Metals Corp (NYSE: WPM) continues to stand out among NYSE-listed basic materials stocks, supported by a technically strong chart structure and improving momentum signals. As a leading gold and silver streaming company, WPM offers leveraged exposure to precious metals prices while maintaining lower operational risk compared to traditional miners.
This WPM stock technical analysis examines price action, trend strength, momentum indicators, and key support and resistance levels to assess the current directional outlook.
WPM Stock Price Action: Multi-Timeframe Trend Confirmation
On the daily chart, WPM is trading firmly above its rising trendline support, confirming the persistence of a broader bullish structure. The stock has consistently formed higher highs and higher lows, a classic hallmark of trend continuation.
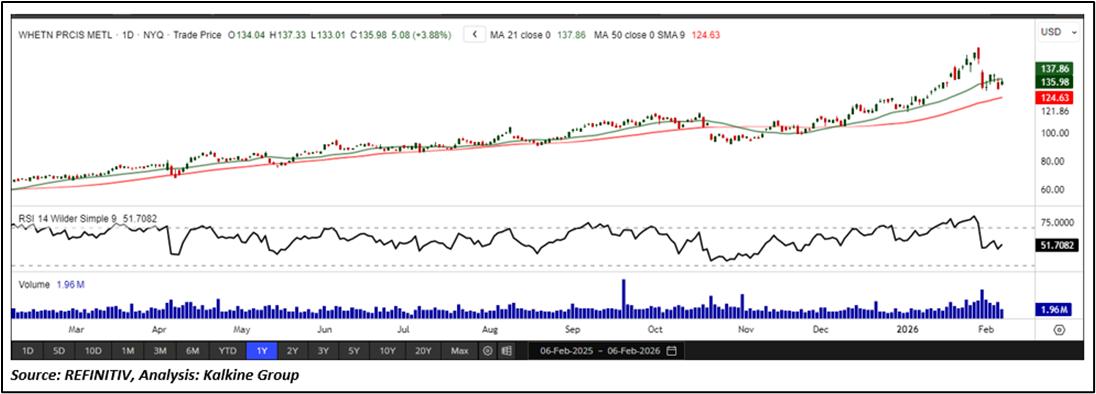
Daily Technical Chart – WPM
Importantly, this bullish setup is reinforced on the weekly timeframe, where price structure continues to trend higher without signs of distribution. Multi-timeframe alignment significantly strengthens the reliability of the prevailing trend.
As of the closing price of USD 135.98 on 06 February 2026, WPM rose 3.88%, marking a decisive rebound from consolidation and signalling renewed upside intent.
Momentum Analysis: RSI Positioned for Expansion
The 14-period Relative Strength Index (RSI) currently stands near 51.70, reflecting stabilisation above the neutral midpoint. After cooling from prior elevated levels, RSI has turned higher, indicating a transition from consolidation to potential momentum expansion.
From a technical standpoint, RSI holding above 50 supports trend continuation. A sustained move into the 60–65 zone would confirm momentum acceleration and elevate WPM into a higher-confidence bullish phase.
Moving Average Structure: Bullish Alignment Intact
WPM continues to trade above its 50-day Simple Moving Average (SMA), which is sloping upward and acting as dynamic support. Short- and medium-term moving averages remain positively aligned above longer-term averages, reinforcing the strength of the underlying trend.
This moving average structure suggests pullbacks are corrective rather than trend-reversing, provided price remains above key averages.
Key Support Levels: Structural Integrity Zones
- USD 120 – Major Support Zone
This level aligns with rising trendline support and prior consolidation. Recent pullbacks into this zone have occurred on declining sell-side volume, indicating limited distribution pressure. - Below USD 120 – Structural Risk Area
A sustained breakdown below this level would weaken the bullish structure and increase downside risk.
Key Resistance Levels: Breakout and Continuation Zones
- USD 152 – Major Resistance
This level represents the upper boundary of the current consolidation range and a key supply zone. - Above USD 152 – Bullish Breakout Territory
A decisive close above USD 152 would complete a consolidation base and imply upside continuation based on prior range expansion, potentially accelerating trend momentum.
Directional Technical Outlook
From a technical perspective, WPM’s directional bias remains upward, supported by:
- Multi-timeframe trend confirmation
- RSI stabilising with scope for expansion
- Bullish moving-average alignment
- Strong support integrity with constructive volume behaviour
Volatility remains constructive rather than disruptive, supporting trend sustainability rather than exhaustion.


 Please wait processing your request...