
 CA
 NZ
 UK
 AU
 IND

 US

 Share
 X (Formerly Twitter)
 Whatsapp
 Facebook
 LinkedIn
 Telegram
 Email This Article
 Copy Link
 Summarize with AI
 Chat GPT
 Perplexity

Key Highlights
- MP closed at $55.62, down -$0.89 (-1.57%) on volume of 3.79M shares, with an intraday range of $54.07–$57.35, extending a frustrating sideways-to-lower drift that has kept the stock range-bound between roughly $50 and $75 for the better part of twelve months following the explosive summer 2025 peak
- Price is currently trading below both the 20-EMA ($59.63) and 50-EMA ($60.63) — and critically, the 50-EMA has crossed above the 20-EMA, forming a bearish EMA crossover that signals the intermediate trend has shifted to the downside following the May 2026 failed breakout
- RSI-14 (41.57) is in bearish territory below the midline and has crossed beneath the signal line (44.11), a configuration that has historically preceded further downside pressure in this name and mirrors the RSI setups ahead of the September 2025 and December 2025 declines
- The $54–$56 zone — where price is currently hovering — represents the lower boundary of the dominant twelve-month range and coincides with a long-term horizontal support level visible as the dotted line across the chart; a decisive close below this level would be technically significant
- Volume has been declining throughout the recent distribution phase, with no meaningful accumulation visible on down days — a pattern consistent with a stock under quiet but persistent selling pressure rather than climactic distribution
- The $50.00 zone and the March 2026 low near $48–$50 represent the next major structural support below current levels; below that, the next reference point is the $40–$42 area that precedes the summer 2025 base
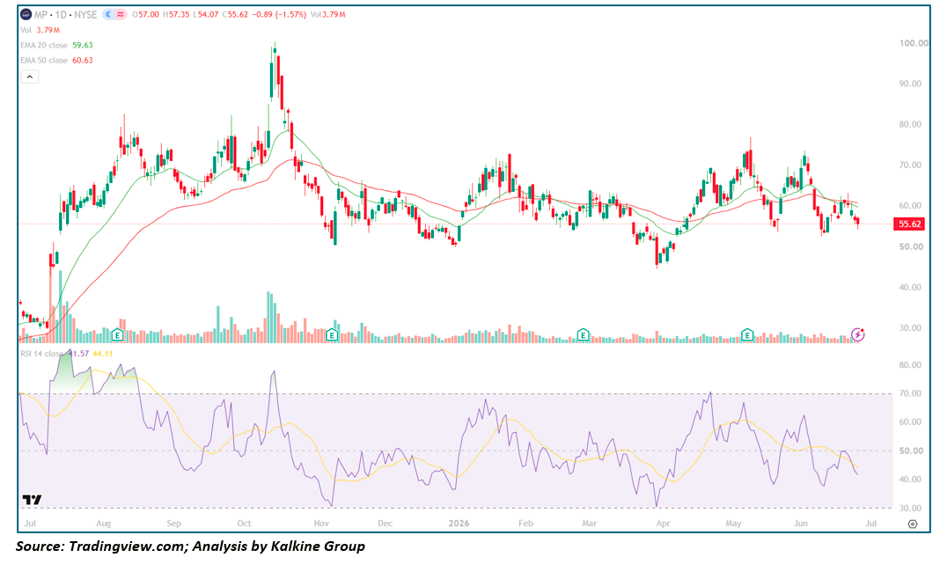
Trend Structure: A Twelve-Month Arc From Explosive Summer Rally to Topping, Distribution, and Now a Prolonged Bearish Range
Phase 1 — The Explosive Summer Rally and Parabolic Peak (Jul – Nov 2025)
The most dramatic episode on this chart dominates the left side: MP Materials surged from roughly $30–$35 in early July 2025 to a cycle peak near $95–$100 by late October — a gain of more than 170% in approximately four months, accompanied by the heaviest volume readings on the entire chart. The initial July surge came with a massive volume spike that appears earnings- or catalyst-driven, propelling the stock above both EMAs simultaneously and establishing the steep uptrend that defined this phase. RSI pushed deeply into overbought territory above 80 during July and again near the October peak, with the signal line chasing the RSI line in the classic late-stage momentum configuration. Both EMAs turned sharply higher throughout this phase, with the 20-EMA providing dynamic support on every meaningful pullback — including a sharp September shakeout that briefly tested the EMA before recovering.
Phase 2 — November Collapse and the First Major Structural Break (Nov 2025)
The reversal from the October peak was swift and severe. A high-volume collapse in November — coinciding with what appears to be an earnings event — carried MP Materials from the $90s toward the $55–$60 range in a compressed timeframe, slicing through both EMAs and leaving behind a textbook distribution top. Volume spiked on the down days during this collapse and RSI crashed from overbought toward the low-30s — one of the two most oversold readings on the chart. This single event effectively ended the bull trend that had begun in July, and the subsequent price action through the rest of the visible chart has been defined by attempts to recover from this damage rather than the establishment of a new uptrend.
Phase 3 — December–January Stabilization and the First Recovery Attempt (Dec 2025 – Jan 2026)
Following the November collapse, MP spent December through mid-January attempting to stabilize in the $52–$65 range, with price oscillating in a wide, choppy band and both EMAs descending toward price from above. RSI recovered from its oversold extreme toward the mid-50s and briefly above 60 during the January bounce — enough to generate optimism but not enough to signal a genuine trend reversal. The 20-EMA crossed back down through the 50-EMA during this period, confirming the intermediate trend had shifted bearish. A brief push toward $65–$68 in late January was rejected, and price rolled back toward the lower end of the range.
Phase 4 — February Bounce, March Capitulation, and the Second Major Low (Feb – Mar 2026)
A second recovery attempt in February carried price from the mid-$50s back toward the $65 zone before the advance again stalled and reversed. The subsequent decline in March was the most damaging since November, with price briefly undercutting the December lows and reaching a new cycle low near $48–$50 — the lowest level since the summer 2025 base. RSI reached its most oversold reading on the chart during this phase, dropping toward 30 and briefly below it, with the signal line lagging as it had at every prior momentum extreme. Volume spiked on the March low session, suggesting at least some capitulation-type selling occurred at this level — an important observation given that the $48–$50 zone has now been established as the deepest support reference in the current cycle.
Phase 5 — April–May Recovery and the Failed Breakout Attempt (Apr – May 2026)
The April–May recovery was the most encouraging development for bulls since the summer 2025 peak. MP surged from the $50–$52 zone toward a high near $73–$75 in early May — a gain of roughly 45% from the March low — with RSI reclaiming overbought territory above 70 for the first time since the October 2025 peak. Both EMAs began curling higher, and for a brief period it appeared as though the twelve-month basing process might be resolving to the upside. However, the May high near $73–$75 failed to sustain, and the subsequent reversal proved sharp and definitive: price collapsed back through both EMAs within a matter of weeks, erasing the majority of the April–May gains and leaving behind yet another failed breakout at a lower high than October 2025 — a structurally bearish development.
Phase 6 — June Distribution and Current Drift Toward Range Lows (Jun 2026)
Since the May failed breakout, MP has been in a steady, low-volatility drift lower — not a collapse, but a relentless erosion of the April–May gains that has carried price from the $70s back toward the current $55 area. Both EMAs have rolled over following the May peak, with the 50-EMA ($60.63) now sitting above the 20-EMA ($59.63) in a bearish alignment. Price trading below both EMAs with the EMAs themselves declining is the most straightforwardly bearish configuration on this chart, and it mirrors the November 2025 and late-February 2026 periods that both preceded further downside. Today's close at $55.62 is approaching the lower boundary of the year-long range, and the technical pressure on this support zone is increasing with each passing session.
Moving Averages: Bearish EMA Cross Confirmed, Both Lines Descending With Price Trapped Below Them
The 50-EMA ($60.63) trading above the 20-EMA ($59.63) is the clearest intermediate-term bearish signal on this chart — a configuration that was absent during the entire summer 2025 advance and only appeared following the November collapse. The fact that this bearish EMA alignment has now been re-established following the May failed breakout confirms that the April–May recovery was a counter-trend bounce rather than the beginning of a new bull phase. For the technical picture to improve meaningfully, MP would need to recapture both EMAs on a closing basis and see the 20-EMA cross back above the 50-EMA — a process that would require sustained buying above the $60–$62 zone for at least 2–3 weeks.
Momentum Analysis: RSI Below 50 and Beneath the Signal Line, Echoing the Pre-Decline Setups of September and December 2025
RSI-14 at 41.57 sitting below the midline and beneath the signal line (44.11) is the momentum configuration that has most reliably preceded further downside in MP Materials over the past twelve months. Both the September 2025 pullback and the December 2025 continuation lower began from RSI setups virtually identical to today's reading — sub-50 RSI crossing beneath a declining signal line while price traded below both EMAs. The absence of any oversold extreme in RSI at current levels is notable: with RSI at 41, there is meaningful room for further deterioration before reaching the 30-level washout readings seen at the December 2025 and March 2026 lows. This suggests the current decline may have further to run before a momentum extreme is reached that would support a durable bounce.
Key Technical Levels
Resistance Levels
- $59.63–$60.63 — 20-EMA and 50-EMA cluster; the immediate overhead supply that has capped every bounce attempt since the May failure
- $65.00–$68.00 — mid-range resistance and the prior January and June bounce highs
- $73.00–$75.00 — May 2026 failed breakout high; the level that would need to be exceeded to change the intermediate-term structure
- $90.00–$100.00 — October 2025 cycle peak; the ultimate bull target and the defining resistance of the entire post-summer distribution
Support Levels
- $54.07 — today's intraday low and immediate near-term support
- $52.00–$54.00 — lower range boundary and the horizontal dotted support line visible across the chart; the level where multiple prior bounces have originated
- $48.00–$50.00 — March 2026 cycle low and the deepest support in the current range; a test of this level would represent approximately a 10% decline from today's close
- $40.00–$42.00 — pre-summer 2025 base and the ultimate structural support below the current range; a breach of $48–$50 would put this zone in play
Scenario Analysis
- Range Support Hold and Bounce (Tactical Bull Case) — If MP holds above the $52–$54 zone and RSI stabilizes near 38–40 before recovering: price could bounce toward the $59–$60 EMA cluster over the following 1–2 weeks, with a stronger recovery targeting the $65–$68 mid-range resistance. This scenario requires the horizontal support line to absorb the current selling pressure as it has on multiple prior occasions — a reasonable possibility given the number of times this zone has attracted buyers over the past twelve months.
- Range Support Failure and March Low Retest (Bear Case) — A decisive close below $52 on expanding volume would break the lower boundary of the year-long range for only the second time — the first being the March 2026 capitulation — and would open the path toward the $48–$50 zone. A test of the March lows would represent roughly a 10–12% decline from current levels and would require an RSI reset toward the 30 zone before any meaningful bottom could be established.
- Continued Slow Erosion Without Capitulation (Base Case) — Given the low-volume, low-volatility character of the current decline, the most probable near-term path may simply be continued grinding lower toward the $52–$54 support zone without a dramatic capitulation event — a slow bleed that eventually tests the range boundary and forces a resolution in either direction. This scenario is the most frustrating for both bulls and bears and is consistent with the overall character of MP's price action since the November 2025 collapse.
Conclusion
MP Materials' close at $55.62 extends a technically deteriorating picture that has now persisted for the better part of twelve months following the October 2025 cycle peak. The stock has failed to establish a new uptrend despite two meaningful recovery attempts — the January bounce and the April–May surge — and each failure has left a lower high and restored the bearish EMA alignment. With RSI below 50 and declining, both EMAs trending lower with price beneath them, and the lower range boundary approaching at $52–$54, the technical burden of proof rests squarely with the bulls. A hold and recovery from $52–$54 that produces a RSI bullish divergence and EMA recapture would offer the first credible evidence that the year-long basing process is nearing completion; absent that, the March 2026 lows near $48–$50 remain a viable near-term destination as the range continues to compress.


 Oct 29, 2026





 Please wait processing your request...