
 CA
 NZ
 UK
 AU
 IND

 US

 Share
 X (Formerly Twitter)
 Whatsapp
 Facebook
 LinkedIn
 Telegram
 Email This Article
 Copy Link
 Summarize with AI
 Chat GPT
 Perplexity
Key highlights
- The S&P 500 was higher a year after all 11 midterms from 1982 to 2022.
- Divided government has averaged a 15 per cent one-year gain, against 11.5 per cent otherwise.
- In 2026, borrowing costs, the Fed and AI matter more than the vote itself.
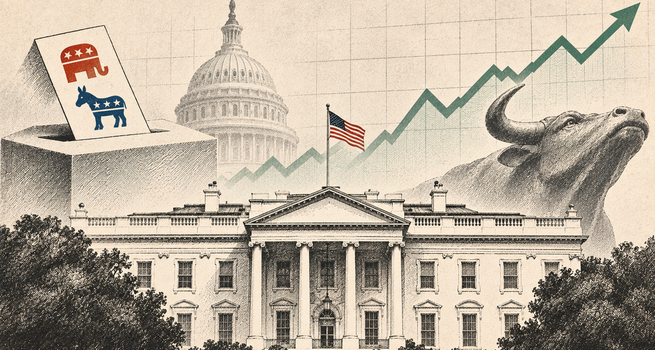
Wall Street gets nervous before every US election, and history says the nerves have not paid off. The 3 November midterms, the national vote held halfway through a president's four-year term, put that record to the test. Republicans hold the House of Representatives 218 to 214 and the Senate 53 to 47, and Democrats need a net four seats in each chamber to take control.
A quiet first week, then a strong year
An analysis of S&P 500 returns after 23 presidential and midterm elections between 1980 and 2024 found a clear pattern. In the day and week after an election the index rose by only 0.2 per cent on average, and by 1.1 per cent over the month. A year on, the index was up 13.7 per cent on average after midterms and 13.8 per cent after presidential elections, and higher in 91 per cent of all cases. Midterms have the cleaner record: the index finished higher a year later after all 11 from 1982 to 2022.
The two kinds of vote differ at the start. After midterms the index gained 0.5 per cent in a day, 1.0 per cent in a week and 1.5 per cent in a month, rising in 73 per cent of cases at each stage. After presidential elections it lost 0.1 per cent in a day and 0.5 per cent in a week, rising in only half of cases, before gaining 0.8 per cent in a month. A year on, 83 per cent of presidential elections had left it higher. Short-term moves are unreliable, especially after presidential races, and the one-year result is the one to trust.
Why gridlock helps
Investors have favoured divided government, where one party holds the White House and the other controls at least one chamber of Congress. After the 10 midterms and five presidential elections that left no party fully in charge, the S&P 500 gained an average of 15 per cent over the next year and rose in 14 of the 15 cases. After elections that gave one party control of everything, the average was 11.5 per cent. One Market strategist explains the logic: a big red or blue wave hands one party enough power to spend freely, and markets like that less.
A Democratic Congress facing a Republican president has precedent. After the midterms of 1986, 1990 and 2006, Democrats held both chambers under a Republican White House. The S&P 500 slipped 0.5 per cent on average on the first day, then rose 3.4 per cent over the month and 10.9 per cent over the year.
Elections are not the main driver
The worst year after any election since 1980 followed the 2000 vote, when the S&P 500 fell 22.1 per cent as the dotcom bubble, a boom in internet shares, burst. The best followed 2020, when the index rose 38.3 per cent as markets recovered from the Covid sell-off. Neither move came from the election. Société Générale argues that Federal Reserve policy, meaning interest rates set by the US central bank, and the cycle of company profits matter more than who wins.
The 2018 midterms show why. Democrats took the House, yet the Fed also raised rates four times that year, and the S&P 500 ended 2018 down 6.2 per cent. A year after the vote, the index was up 11.7 per cent. Ned Davis Research adds a caution: across eight times since 1930 that the president's party lost the House, the index rose for the rest of the year in five of them.
Why 2026 is different
The market comes into this vote with a strong year behind it. The S&P 500 has gained 27 per cent since Mr Trump returned to office in January 2025, led by the AI boom, and Bank of America puts this year's gain at 13 per cent against a midterm-year average of 3 per cent. Four risks sit alongside it.
- Borrowing costs. The 10-year Treasury yield, the Interest Rate the US government pays to borrow for a decade, rose above 5 per cent on 28 October. It sets the cost of mortgages and company loans, and a high yield makes shares less attractive because safe bonds pay more. The Fed lifted its main rate to 3.75 to 4.00 per cent in September. Yields are rising worldwide, and a Debt scare in France adds to the nerves.
- AI. Microsoft (NASDAQ:MSFT), Amazon (NASDAQ:AMZN), Alphabet (NASDAQ:GOOGL) and Meta (NASDAQ:META) are set to spend more than 1 trillion dollars in 2027 on capital projects such as data centres. Strategists expect a Democratic sweep of both chambers to put that buildout under pressure, and a poll found 63 per cent oppose a data centre within 10 miles of their home, against 13 per cent in favour.
- Iran. The war with Iran is unresolved. Mr Trump has threatened more strikes, and an Iranian escalation after the vote would add to the strain.
- Washington's calendar. The stopgap law funding the government expires on 11 December. The Bipartisan Policy Center projects the US hits its debt ceiling, the legal cap on federal borrowing, between winter and mid-summer of 2027. Debt-ceiling fights in 2011 and 2023 each brought a credit-rating downgrade.
What it means for investors
Deutsche Bank's head of macro research warns that seasonal patterns are not destiny, and that worries over Iran, AI and France do not disappear on election night. This is still an AI-driven market, and the Fed, the Bond Market and geopolitics rank ahead of the election in setting its direction.
The record says a midterm ends a period of uncertainty, and stocks have been higher a year later every time since 1982. The 2026 vote arrives with yields above 5 per cent and a war in the background, so treat the history as a tailwind and not a guarantee.


 Nov 04, 2026




 Please wait processing your request...