
Image source: Shutterstock
Highlights
- In FY24, Freeport’s revenue increased by 11.4% YoY on the back of higher average realized prices for both copper and gold
- Net income to common shareholders rose by 2.2% YoY, supported by the revenue growth
- FCX expects consolidated sales volumes of around 4.0bn lbs of copper, 1.6mn oz of gold, and 88mn lbs of molybdenum for FY25
Freeport-McMoRan Inc. (NYSE:FCX) is a global mining company that operates a range of geographically diverse assets, holding substantial proven and probable reserves of copper, gold, and molybdenum.
FY24 Financial Update
In the financial year 2024 (FY24), the company’s revenue increased by 11.4% YoY, reaching USD 25,455 million, driven by higher average realized prices for both copper and gold.
During the reported period, net income available to common shareholders rose by 2.2% YoY to USD 1,889 million, supported by the revenue growth, though partially offset by increased costs and expenses. Meanwhile, net operating cash inflows surged by 35.6% YoY to USD 7,160 million, benefiting from the increased net income and favorable changes in net working capital.
However, total cash and cash equivalents decreased by 17.5% YoY to USD 3,923 million, mainly due to cash outflows from investing and financing activities, partially mitigated by the inflows from operating activities.
Recent Business Update
Company Outlook
Looking ahead to 2025, FCX expects consolidated sales volumes of around 1.6mn oz of gold, 4.0bn lbs of copper, and 88mn lbs of molybdenum. For 1Q2025, projections are 850mn lbs of copper, 225koz of gold, and 22mn lbs of molybdenum.
With average prices of USD 4.00 per pound for copper, USD 2,700 per ounce for gold, and USD 20.00 per pound for molybdenum, operating cash flows are expected to be USD 6.2 billion.
Capital expenditures are forecasted at USD 5.0 billion, including USD 2.8 billion for major projects.
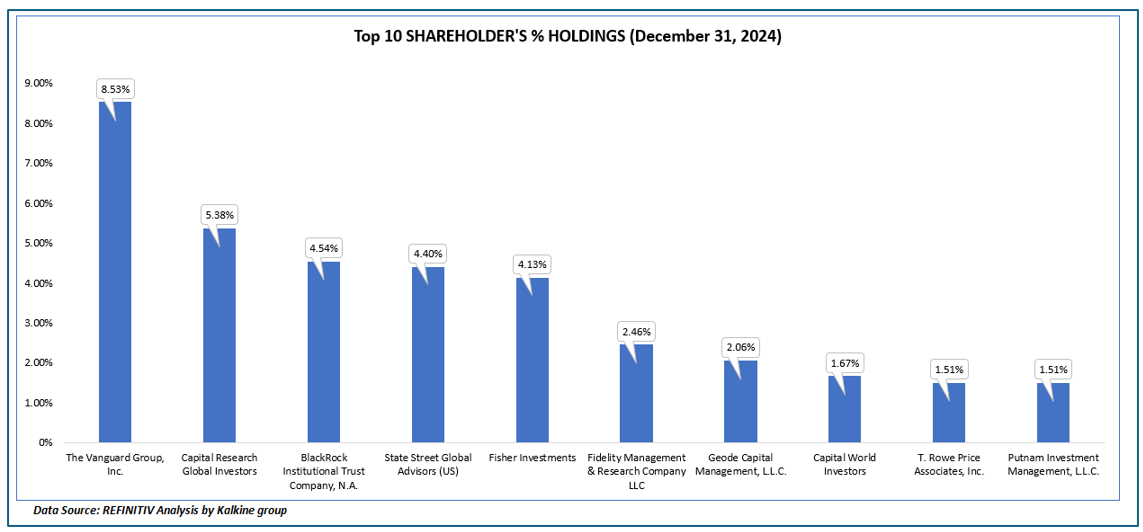
Top 10 shareholders
The top 10 shareholders of Freeport account for approximately 36.21% of the total shares, indicating a concentrated ownership structure. The largest stakes are held by The Vanguard Group, Inc. and Capital Research Global Investors, with ownership of 8.53% and 5.38%, respectively.
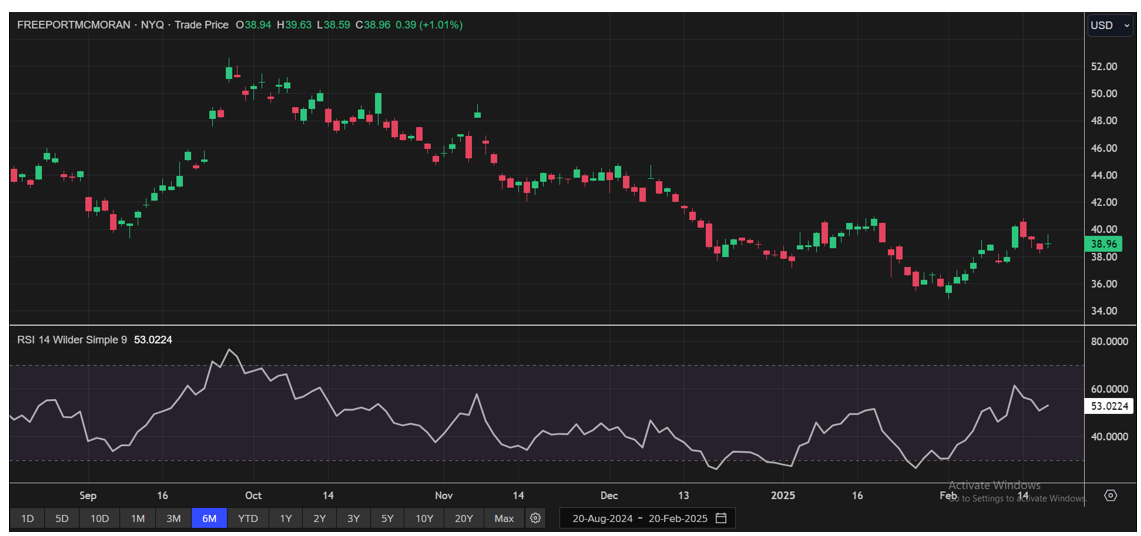
Stock Performance
The stock has experienced a decline of 11.74% over the past three months, and a slightly larger drop of 12.12% in the last six months. Currently, it is trading near the lower end of its 52-week range, which spans from a high of USD 55.24 to a low of USD 38.19.
Note 1: Past performance is not a reliable indicator of future performance.
Note 2: The reference date for all price data, currency, technical indicators, support, and resistance levels is February 20, 2025. The reference data in this report has been partly sourced from EODHD/Others.


 Please wait processing your request...