
 CA
 NZ
 UK
 AU
 IND

 US

 Share
 X (Formerly Twitter)
 Whatsapp
 Facebook
 LinkedIn
 Telegram
 Email This Article
 Copy Link
 Summarize with AI
 Chat GPT
 Perplexity
Key words: S&P 500, S&P 500 2020s, S&P 500 returns, US stock market, stock market bull run, 2020s bull market, S&P 500 historical returns, best stock market decades, US equities, Wall Street bull market, S&P 500 performance, stock market history
Key Highlights
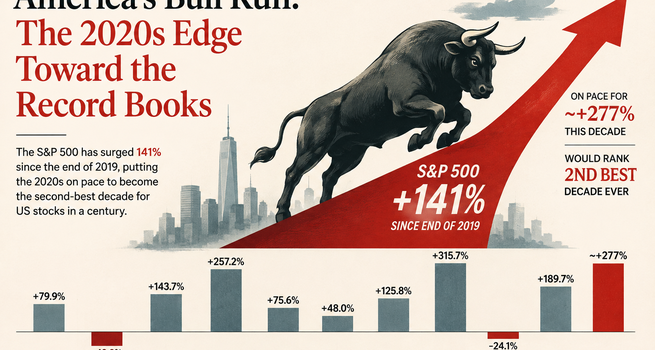
- The S&P 500 has gained +141.0% since the end of 2019, one of the strongest starts to any decade on record.
- At the current pace, the index would finish the 2020s up roughly +277%.
- That would rank as the second-best decade in the S&P 500's history, behind only the +315.7% return of the 1989-1999 dot-com boom.
- It would also surpass the +257.2% gain of the 1949-1959 postwar boom.
- The 2010s, which followed the 2008 financial crisis, returned +189.7% — the 2020s are running well ahead of that recovery decade.
- Only two decades in a century of data show losses: the 1930s (-49.8%, the Depression) and the 2000s (-24.1%, the dot-com bust and financial crisis).
A Century in Bar Charts
Wall Street has a habit of surprising even those who watch it closely. A century of decade-by-decade returns for the S&P 500, tallied from the end of each calendar year, reads like a heart-rate monitor: the euphoria of the 1920s, the flatline of the Depression, the long postwar climb, the dot-com mania and its hangover. Against that backdrop, the current decade stands out. Since December 31st 2019 the index has returned +141.0%, a figure that includes a pandemic, the fastest rate-tightening cycle in 40 years and two regional banking scares. Few decades have delivered so much return for so much apparent turbulence.
Doing the Math on What's Left
Extrapolation is a dangerous game in markets, but the arithmetic is instructive. If the S&P 500's pace since 2019 simply continues through the remainder of the decade, the cumulative gain would land near +277%. That would be enough to leapfrog the 1949-1959 postwar boom (+257.2%) and settle into second place behind only the 1989-1999 dot-com run (+315.7%). It would also comfortably outstrip the 2010s (+189.7%), the last decade to begin in the shadow of a crisis. Put differently: the market has needed only six years to produce a return that took the entire previous decade to achieve.
What Is Driving It
Three forces stand out. First, a small group of dominant technology and semiconductor companies has compounded Earnings at rates unseen outside the dot-com era, this time backed by actual cash flow. Second, corporate America emerged from the Pandemic leaner, with margins that proved more durable than economists expected through a tightening cycle. Third, the Federal Reserve's pivot away from restrictive policy has removed one of the market's biggest overhangs, freeing valuations to expand alongside earnings rather than against them.
The Caveats
History counsels humility here. The two prior decades that rank above or near the current pace — the 1920s and the 1990s — both ended not with a plateau but with a crash. A run this strong six years in is no guarantee of a smooth final stretch; the last four years of any decade have, at various points in the past century, erased gains as quickly as they built them. The projection to +277% also assumes the current rate holds, which presumes away recessions, valuation resets and geopolitical shocks — precisely the kind of events that have reshaped every prior decade on the chart. The 2020s are, for now, writing a remarkable chapter. Whether it ends as a record or a cautionary tale remains, as ever, an open question.
Disclaimer: All figures are calculated from calendar year-end levels (December 31st) except the 1921 starting point, which reflects January 1921. Data source: LSEG Datastream and Yardeni Research; Standard & Poor's. Past performance is not indicative of future results. This article is for informational purposes only and does not constitute Investment advice.


 Nov 13, 2026




 Please wait processing your request...