_06_11_2026_00_01_09_368404.jpg)
Key Highlights
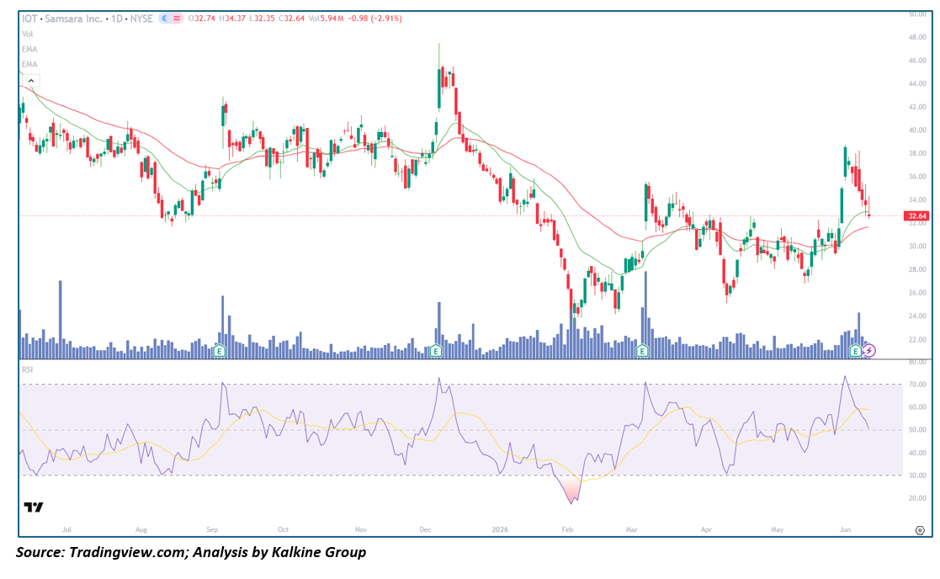
- IOT is trading near $34–$36, having recovered from a 52-week low of $23.38 — approximately 45% above the cycle bottom — but still well below the 52-week high of $47.47, creating a stock that is technically recovering but not yet in breakout territory
- The EMA-21 and EMA-50 have recently crossed bullishly — a golden cross structure on the short-term timeframe that historically precedes sustained directional advances in momentum-driven SaaS names
- ARR of $1.99 billion is approaching the psychologically important $2 billion milestone — a level that typically triggers institutional re-classification and attracts a new cohort of large-cap-adjacent funds
- GAAP EPS profitability for the third consecutive quarter in Q1 FY2027 is a structural milestone that removes the stock from exclusion lists maintained by profitability-screened funds, mechanically expanding the potential buyer universe
- Revenue of $478.8 million grew 31% year-over-year with a non-GAAP operating margin of 19% — a rare combination of 30%+ growth and expanding profitability that only a handful of SaaS businesses achieve simultaneously
- Despite the fundamental improvement, the stock is down approximately 20% over the past twelve months — a persistent discount to fundamental value that is beginning to attract value-growth crossover investors who focus on businesses inflecting toward profitability
Trend Structure: Capitulation Bottom and Early Recovery
Phase 1 — Extended Downtrend and Distribution (Mid 2025 – Early 2026)
Samsara spent the better part of 2025 in a protracted downtrend from the $61 all-time high to the $23 cycle low — a decline of over 60% driven by a combination of macro multiple compression, concerns about path-to-profitability, and rotation away from high-growth IoT names toward pure-play AI plays. Volume increased on down moves throughout this phase, confirming institutional selling rather than retail capitulation.
Phase 2 — Capitulation and Base Formation (Feb – Apr 2026)
The $23–$25 zone produced what appears in retrospect to be a genuine capitulation bottom — the final flush of weak holders on exhausting volume, followed immediately by a reversal and sustained recovery. This pattern — high volume bottom followed by lower volume recovery — is the textbook structure of professional accumulation absorbing the final wave of forced selling.
Phase 3 — Recovery and Moving Average Reclamation (May – Jun 2026)
The recovery from the $23 low to the current $34–$36 range has been accompanied by improving breadth, rising RSI, and the constructive EMA crossover structure referenced above. Price is now testing the EMA-50 from below — the decisive battle that will determine whether the recovery has sufficient institutional backing to sustain higher prices.
Fundamental Foundation: The Physical Operations Economy Inflection
Samsara's connected operations platform addresses a $40+ trillion global physical operations economy — trucking, construction, logistics, utilities, government fleets — that is still in the early innings of digitisation and IoT adoption. Non-GAAP operating margin expanded from 9% in fiscal 2025 to 17% for full fiscal 2026, with Q4 reaching 21% — a rate of margin expansion that is exceptional for any software business at this revenue scale.
Large enterprise customer adoption is accelerating, with customers contributing over $100,000 in ARR growing 37% year-over-year. The cohort of million-dollar ARR customers is expanding, reflecting successful upmarket motion that is fundamentally transforming the revenue quality of the business.
The $2 Billion ARR Catalyst
The approach to $2 billion ARR is not merely a round number — it is a threshold that changes institutional perception. At sub-$2 billion ARR, Samsara is a high-growth IoT software company. At $2 billion ARR with 30% growth and expanding profitability, it is a large-scale enterprise software platform with compounding cash flow characteristics. The re-rating that accompanies this transition — particularly given the three consecutive GAAP profitable quarters — could be more dramatic than current consensus pricing implies.
Key Technical Levels
Resistance: $38–$40 — EMA-50 and near-term overhead supply | $44–$47 — prior consolidation zone and 52-week high approach
Support: $33–$35 — current trading zone and EMA-21 | $28–$30 — prior recovery base | $23–$25 — 52-week low and catastrophic bear scenario
Scenario Analysis
- Bullish Breakout: EMA-50 reclaimed at $38–$40 with expanding volume → RSI breaks above 60 → $44–$47 52-week high tested within 6–8 weeks
- Range Consolidation: Price oscillates $30–$38 for several weeks while the EMA-50 catches up to price → $2 billion ARR milestone announcement serves as the breakout catalyst
- Bearish Retest: Macro risk-off breaks $30 support → retest of the $23–$25 capitulation low → highest-conviction long-term entry for patient investors
Conclusion
Samsara is one of the most compelling recovery stories in the mid-cap universe — a business with 31% revenue growth, approaching $2 billion ARR, and three consecutive GAAP profitable quarters trading near multi-year lows. The technical structure is inflecting constructively from the capitulation bottom. Above $40 the recovery becomes a breakout. The $23–$25 low represents the structural floor that the business fundamentals make essentially indefensible as fair value.


_06_10_2026_23_58_15_597808.jpg)
_06_10_2026_23_59_01_962593.jpg)

 Please wait processing your request...