
Key Highlights
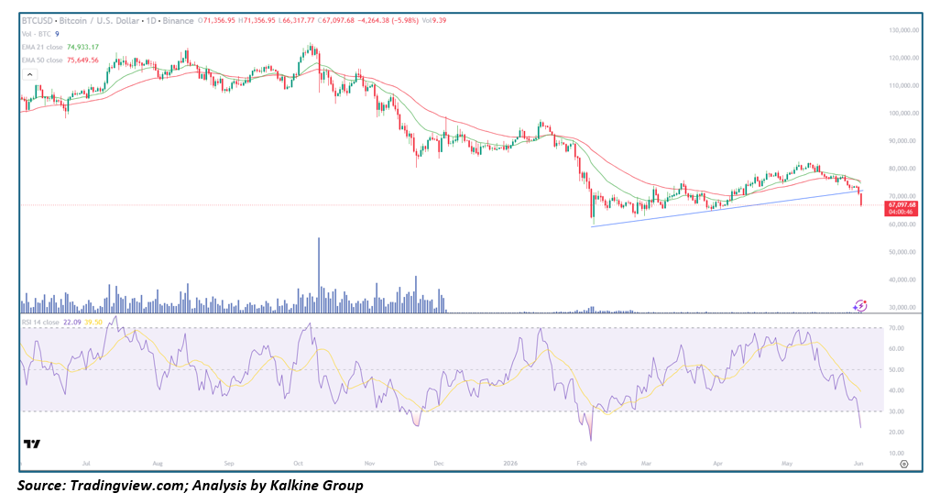
- Bitcoin has suffered a decisive breakdown below both the EMA-21 and EMA-50, signaling a deterioration in the medium-term trend structure
- Price has violated a key ascending Trendline that had supported the recovery rally since February, increasing the probability of further downside
- The EMA-21 remains below the EMA-50, confirming bearish trend alignment and continued seller control
- RSI has collapsed to approximately 22, entering deeply oversold territory and reflecting extreme negative momentum
- The latest selloff has been accompanied by aggressive downside price expansion, indicating heightened market uncertainty and risk-off sentiment
Trend Structure: From Record Highs to Critical Technical Breakdown
Phase 1 — Institutional Expansion and New Cycle Highs (Mid-2025)
Bitcoin extended its long-term Bull Market during 2025:
- Institutional adoption continued accelerating through ETF inflows and corporate treasury participation
- Investor confidence strengthened as Bitcoin established new all-time highs above $120,000
- Price remained consistently above major moving averages throughout most of the advance
- Momentum indicators frequently entered overbought territory during periods of strong Capital inflows
- Bitcoin maintained Leadership across the broader digital asset market
The strong advance ultimately pushed valuations into increasingly extended territory.
Phase 2 — Distribution and Trend Reversal (Late 2025 – Early 2026)
Following the cycle peak, market conditions deteriorated:
- Profit-taking emerged after the parabolic rally
- Selling pressure increased as macroeconomic uncertainty impacted risk Assets
- Bitcoin broke below key moving averages, signaling a shift in market structure
- Multiple recovery attempts failed near major resistance zones
- Institutional accumulation slowed as investors adopted a more defensive posture
This phase marked the transition from bullish expansion to a corrective market environment.
Phase 3 — Recovery Attempt Fails and Trendline Breakdown Emerges (2026 – Present)
The current technical structure reflects increasing downside risk:
- Bitcoin recently attempted to establish a recovery trend from the February lows
- An ascending support trendline guided the rebound for several months
- Price has now broken decisively below that trendline, invalidating the recovery structure
- The breakdown has occurred while trading beneath both EMA-21 and EMA-50
- Bears have regained short-term control as momentum accelerates lower
The chart now suggests a heightened probability of continued weakness unless buyers quickly reclaim lost support levels.
Moving Averages: Bearish Alignment Remains Intact
EMA-21
- Bitcoin currently trades significantly below the EMA-21 near $74,933
- The downward slope confirms deteriorating short-term momentum
- Recent rallies have repeatedly failed beneath the Moving Average
EMA-50
- The EMA-50 near $75,650 continues acting as major overhead resistance
- Price remains firmly below this medium-term trend indicator
- Sustained trading beneath both moving averages reinforces the bearish technical outlook
Momentum Analysis: RSI Signals Capitulation Conditions
Bitcoin's momentum profile has weakened dramatically:
- RSI has fallen to approximately 22, one of the lowest readings seen in recent months
- The indicator is deeply oversold and reflects extreme selling pressure
- While oversold conditions can trigger short-term relief rallies, they do not automatically signal a durable bottom
- Momentum currently favors sellers until a meaningful bullish divergence emerges
The current RSI structure highlights market stress rather than recovery.
Volume Analysis: Selling Pressure Intensifies
Recent trading activity confirms growing bearish participation:
- The breakdown has been accompanied by expanding downside momentum
- Market Participants appear increasingly focused on capital preservation
- No clear accumulation signals are yet visible within the current structure
- Elevated selling activity suggests institutions may still be reducing exposure
Volume behavior currently supports the bearish trend continuation scenario.
Fundamental Catalysts: Macro Uncertainty and Risk Sentiment Drive Volatility
Risk Asset Repricing
Bitcoin remains highly sensitive to global Liquidity conditions:
- Rising uncertainty across financial markets can pressure speculative assets
- Risk-off capital flows often create short-term volatility within cryptocurrencies
- Investor positioning remains heavily influenced by macroeconomic developments
Institutional Flows
Institutional participation continues to play a major role:
- ETF inflows and outflows remain critical drivers of price direction
- Changes in institutional risk appetite can significantly impact momentum
- Large-scale allocation decisions continue shaping overall market trends
Long-Term Adoption Remains Intact
Despite current weakness:
- Bitcoin remains the dominant digital asset globally
- Institutional infrastructure continues expanding
- Long-term adoption trends remain constructive even during cyclical corrections
Key Technical Levels
Resistance
$70,000–$72,000 (broken support turned resistance) → $75,000 (EMA resistance zone) → $80,000 (major recovery barrier)
Support
$65,000–$66,000 (current support area) → $60,000 (major psychological support) → $55,000 (next downside projection)
Conclusion
Bitcoin's technical picture has deteriorated materially following a decisive break below both major moving averages and the multi-month ascending trendline that supported the recovery from February lows. The combination of bearish moving-average alignment, accelerating downside momentum, and an RSI near 22 suggests sellers currently maintain firm control of the market.
While deeply oversold conditions could trigger a short-term bounce, the broader technical structure remains vulnerable until Bitcoin can reclaim the $70,000–$75,000 resistance region. Unless buyers quickly re-establish support above the broken trendline, the risk of further downside toward the $60,000 area remains elevated in the near term.


 Please wait processing your request...