
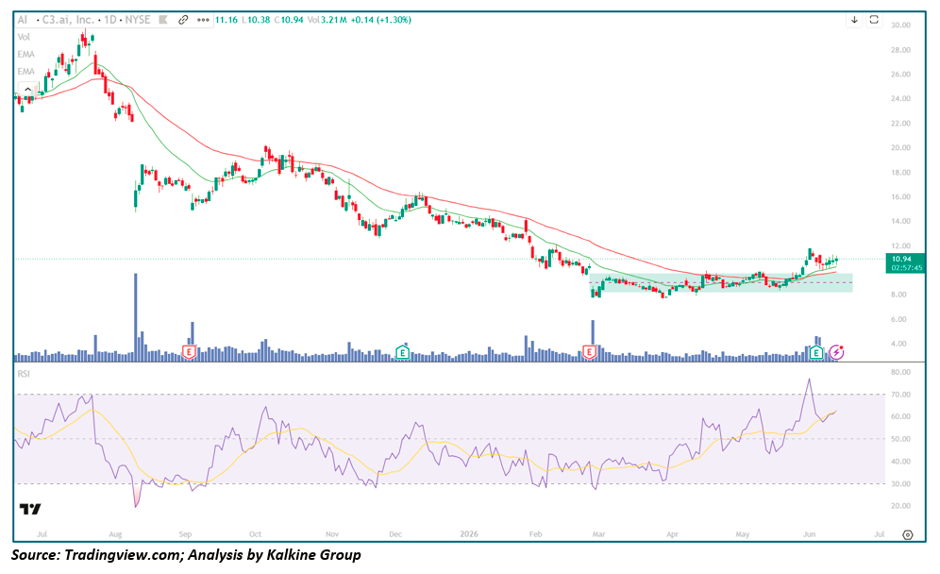
Key Highlights
- AI closed at $10.94, gaining +$0.14 (+1.30%) on volume of 3.21M shares, with an intraday range of $10.38–$11.16 — a modest but constructive session consolidating recent gains after a significant recovery off the multi-month base
- Price has broken decisively above the green shaded accumulation zone ($8–$10) that served as the base for the last four months, with the stock now trading above $10 for the first time since early 2026
- Both EMAs — the EMA-21 (green) and EMA-50 (red) — are beginning to converge and flatten after more than a year of relentless bearish separation, signalling that the long-term downtrend is losing momentum and a structural trend change may be underway
- RSI-14 has surged from deeply oversold levels (~20–25) in mid-2025 to approximately 60–65, the highest sustained reading since the stock peaked near $28 in July 2025 — confirming genuine momentum accumulation rather than a short-covering bounce
- Four distinct earnings catalyst events ("E" markers) are visible across the chart — the most recent (June 2026) coinciding with the strongest volume spike in months and the breakout above the $10 psychological resistance level
- The stock has declined from a peak of approximately $28 in July 2025 to its base lows near $8 — a drawdown exceeding 70% — making the current recovery attempt one of the most significant potential trend reversals in the enterprise AI sector
- The $11–$12 zone represents the immediate overhead resistance from prior support-turned-resistance established during the November–December 2025 consolidation, while a sustained hold above $10 is the minimum requirement to maintain the current bullish structure
Trend Structure: Year-Long Decline, Deep Basing, and an Emerging Recovery
Phase 1 — Peak and the Beginning of the Structural Decline (Jul – Sep 2025)
C3.ai entered the visible chart period already showing signs of distribution from its peak near $28:
- Price was in a steep downtrend from the outset, with both EMAs declining sharply and the EMA-21 (green) running well below the EMA-50 (red) — a classic bearish EMA configuration reflecting sustained institutional selling
- Volume spiked heavily around the September 2025 earnings event ("E" marker), suggesting the catalyst was received negatively or used as an exit opportunity by larger holders
- RSI reached deeply oversold territory near 20 in this phase — an extreme reading that reflected the severity of the selling pressure rather than a genuine bottoming signal, as the trend was still clearly intact to the downside
- The stock fell from ~$28 to approximately $15 during this phase — a rapid 46% decline in under three months
Phase 2 — Persistent Decline and Failed Recoveries (Oct 2025 – Feb 2026)
The October through February period was characterised by repeated failed recovery attempts that were systematically rejected by the declining EMAs:
- Each rally attempt was sold into aggressively, with price failing to sustain above the declining EMA-21 on any meaningful basis — a hallmark of a stock in a well-established institutional downtrend
- The December 2025 earnings event ("E" marker) produced a brief spike to approximately $16–$17 before being completely reversed, reinforcing the pattern of sell-the-news reactions
- RSI oscillated between 30 and 65 during this phase — occasionally reaching overbought on bounces but consistently failing to sustain momentum above 60, signalling that rallies were being used for distribution rather than re-accumulation
- Price declined from approximately $15 in October to the $8–$9 range by January–February 2026, completing a full drawdown of over 70% from the July 2025 peak
Phase 3 — Deep Base Construction and Quiet Accumulation (Mar – May 2026)
The green shaded zone on the chart (~$8–$10) marks the multi-month accumulation base that laid the groundwork for the current recovery:
- Price stabilised within a defined $8–$10 range for approximately four months, with both EMAs finally beginning to flatten and converge — the clearest sign yet that the year-long downtrend was exhausting itself
- The March 2026 earnings event ("E" marker) produced a sharp volume spike — the largest single-day volume reading since the peak — but price held the $8 level rather than making new lows, a critical non-confirmation of the prior downtrend
- RSI began recovering from the 30–35 zone and establishing higher lows within the base period — a quiet but meaningful positive divergence as momentum was improving while price remained rangebound
- The dashed horizontal line visible within the green shaded zone marks the midpoint of the base (~$9.00) which acted as a pivot level during this accumulation phase
- Volume normalised to subdued levels throughout most of this period, consistent with patient institutional accumulation ahead of a potential recovery catalyst
Phase 4 — Breakout Attempt and Emerging Recovery (Jun 2026)
The most recent earnings event ("E" marker, June 2026) appears to have been the catalyst that finally broke the stock out of its four-month base:
- The June earnings session produced one of the heaviest volume spikes visible in the base formation period, accompanied by a decisive move above $10 — the psychological and technical resistance level that had capped every prior recovery attempt
- Price has now printed a series of higher highs and higher lows above $10 — the first sustained bullish structure in over a year
- The EMA-21 (green) has crossed above or is in the process of crossing above the EMA-50 (red) — if confirmed on a sustained basis, this would represent the first bullish EMA crossover for AI since the stock was trading near its peak, making it an extremely significant structural signal
- RSI has surged to approximately 60–65 and the signal line (yellow) is tracking above 55 — both readings confirm that this is genuine momentum accumulation rather than a temporary oversold bounce
Moving Averages: The Most Important EMA Development in Over a Year
EMA-21 (Green) The short-term EMA has reversed its multi-month decline and is now curling sharply higher. Price is trading above the EMA-21 for the first time on a sustained basis since mid-2025 — a development that marks a fundamental shift in the short-term trend structure. Any pullback that holds the EMA-21 as support would be a high-conviction confirmation that the character of this stock has changed from one of sell-the-rally to buy-the-dip.
EMA-50 (Red) The longer-term EMA-50 remains elevated above the EMA-21 and reflects the lingering overhead supply from the year-long downtrend. However, it is beginning to flatten and curve lower toward the rising EMA-21. A confirmed bullish crossover — with the EMA-21 moving above the EMA-50 — would be the most powerful structural signal on this chart and would likely attract significant algorithmic and momentum-based buying. This crossover appears imminent given the current trajectory of both moving averages.
Momentum Analysis: RSI at Its Most Constructive Reading in Over a Year
RSI-14 at approximately 60–65 and trending higher represents the most bullish sustained momentum reading since the stock was near its peak:
- RSI had spent the majority of the July 2025 through February 2026 period oscillating between 25 and 55 — a range consistent with a bearish trending market where rallies fail and downtrends resume
- The current RSI trajectory — making sustained higher highs above 60 for the first time in over a year — suggests the character of momentum has fundamentally shifted
- The signal line (yellow) crossing below the RSI line and tracking at approximately 55–58 provides a positive momentum confirmation that reinforces the bullish case
- The key RSI threshold to watch is 70: a move to and sustained hold above 70 would confirm the stock has entered a genuine bull phase; a failure and reversal from 65–70 would suggest the recovery is running into supply from prior holders using the bounce as an exit opportunity
- The deeply oversold RSI readings (~20–25) reached during the worst of the 2025 decline were the most extreme on the visible chart — the subsequent recovery of RSI to current levels mirrors the pattern of major bottoming processes seen in other enterprise software names
Key Technical Levels
Resistance Levels
- $11.00–$11.16 — today's intraday high and immediate near-term resistance
- $12.00 — prior support level from the November–December 2025 consolidation, now acting as overhead resistance
- $14.00–$15.00 — the next major resistance zone from the October–November 2025 failed recovery highs
- $19.00–$20.00 — the mid-decline consolidation zone that acted as support during the October correction; significant medium-term resistance
- $28.00 — July 2025 cycle high; ultimate bull target for a full recovery
Support Levels
- $10.00 — psychological round number and the top of the prior four-month base; the critical near-term floor
- $9.00 — midpoint of the green accumulation zone; first meaningful support on any pullback
- $8.00 — the base of the multi-month accumulation zone and the cycle low area; the line that must not be breached to preserve the recovery thesis
- Sub-$8.00 — a close below $8 would signal the breakout has failed and a retest of the lows is underway
Scenario Analysis
- Bullish Continuation (Primary Case) If AI sustains above $10 and the EMA crossover is confirmed: → RSI pushes above 70, confirming the stock has entered a genuine bull momentum phase → Price advances toward the $12 resistance zone — the first major technical target above the current base → The EMA-21 provides dynamic support on any pullbacks, as it did during the final stages of the July 2025 peak → Fundamental tailwinds from enterprise AI adoption, government AI contracts, and the broader re-rating of AI infrastructure names provide the catalyst layer for sustained institutional re-accumulation → Medium-term target: $14–$15 on a sustained break above $12
- Consolidation and Base Extension (Constructive) Price oscillates between $10 and $12 for several sessions, building a higher base before a directional move: → RSI consolidates in the 50–65 range, digesting the recent surge without deteriorating → The EMA crossover is confirmed during this period, adding further technical weight to the bull case → A consolidation at this level would be constructive — each day held above $10 reinforces the base and reduces the risk of a round-trip → A fresh catalyst — earnings beat, contract win, or sector re-rating — would be the likely trigger for the next leg higher
- Failed Breakout (Risk Case) A close back below $10 on heavy volume would raise concerns: → Price risks returning to the $8–$9 accumulation zone for further base-building → RSI falling back below 50 would negate the momentum signal and suggest the June earnings reaction was a sell-the-news event rather than a genuine trend change → A break below $8 would be the most bearish outcome — invalidating the entire base structure and opening the door to new cycle lows → This scenario becomes materially more likely if the broader market sell-off (the S&P 500 is down -1.62% on the day) intensifies and risk appetite deteriorates across high-beta technology names
Conclusion: C3.ai at Its Most Technically Constructive Juncture in Over a Year — But the Burden of Proof Remains on the Bulls
After enduring a drawdown exceeding 70% from its July 2025 peak, C3.ai has produced the most technically constructive setup since the stock was near its highs. The four-month base in the $8–$10 zone, the imminent EMA crossover, the surging RSI at its highest sustained level in over a year, and the June earnings-driven breakout above $10 all point toward a genuine trend reversal in progress. However, one month of constructive price action following a year-long decline demands a measured rather than aggressive response — the burden of proof remains firmly on the bulls to demonstrate that this recovery has staying power.
The framework going forward is clear:
- Sustained above $12 → breakout confirmed, prior resistance cleared, target $14–$15
- Hold at $10–$11 → base consolidation, recovery intact, accumulation opportunity
- Close below $10 → breakout in question, risk of return to $8–$9 base zone
- Close below $8 → recovery thesis invalidated, new cycle lows possible
For patient investors in the enterprise AI space, the $10–$11 zone — representing the top of a four-month accumulation base with a confirmed momentum shift and an imminent bullish EMA crossover — offers the most compelling risk-defined entry point in C3.ai since the stock peaked above $28 a year ago. The risk is clear ($8 as the hard stop), the reward is asymmetric, and the technical evidence is — for the first time in over a year — pointing in the right direction.


_06_11_2026_22_43_52_812084.jpg)

 Please wait processing your request...