_06_11_2026_22_43_52_812084.jpg)
Key Highlights
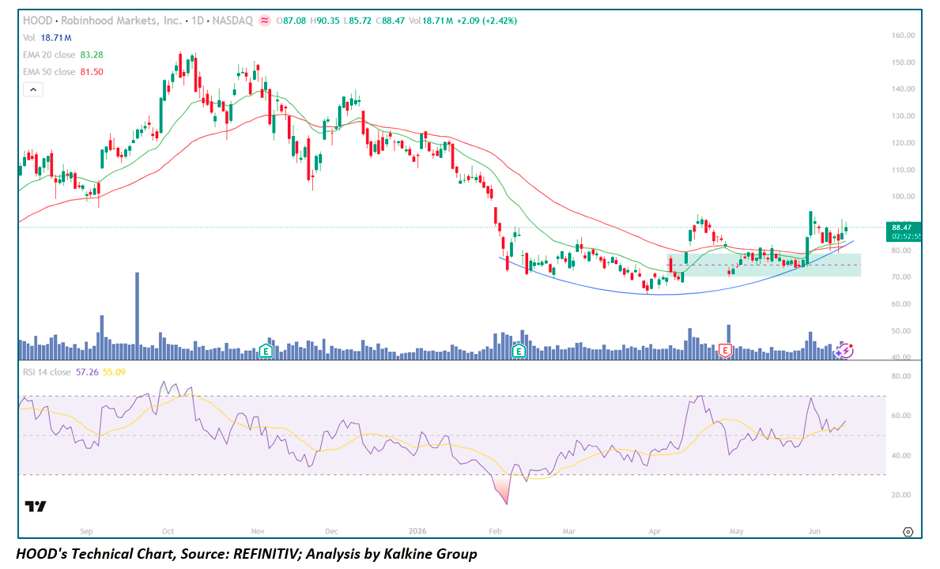
- HOOD closed at $88.47, gaining +$2.09 (+2.42%) on volume of 18.71M shares, with an intraday range of $85.72–$90.35 — a constructive session building on recent momentum above the critical $80 psychological level
- EMA-20 stands at $83.28 and EMA-50 at $81.50, with price trading meaningfully above both — the first sustained bullish EMA configuration for HOOD in several months
- RSI-14 reads 57.26 with the signal line at 55.09, sitting in constructive mid-range territory with room to run before overbought conditions become a concern
- The chart reveals a textbook cup-and-handle base structure — a multi-month rounded bottom from October 2025 through March 2026 followed by a consolidation handle and a breakout above $80 — one of the most reliable continuation and reversal patterns in technical analysis
- Three earnings events ("E" markers) are visible across the chart, with the most recent April 2026 catalyst appearing to serve as the ignition event for the current breakout leg above the base
- The stock has declined from a peak of approximately $145–$150 in November 2025 to base lows near $65 in February 2026 — a drawdown exceeding 55% — before staging the current recovery that has already retraced approximately one-third of that decline
Trend Structure: From Peak Distribution to Cup-and-Handle Breakout
HOOD's chart over the past ten months tells a clear three-act story. The first act — August through November 2025 — saw the stock surge from approximately $100 to a peak near $150, driven by momentum and a broadly risk-on environment. The EMA-20 (green) tracked closely below price throughout this advance, providing reliable dynamic support and confirming the strength of the uptrend. However, the distribution phase began in earnest from the November peak, with both EMAs rolling over sharply and price entering a sustained multi-month decline.
The second act — December 2025 through February 2026 — was the most painful. Price fell in a near-waterfall decline from the $125 range to the base lows near $65, with both EMAs declining steeply and the EMA-20 running below the EMA-50 in a classic bearish configuration. RSI reached an extreme low near 20 — the pink shaded region visible on the RSI panel — marking the most oversold conditions of the entire visible chart. Crucially, this extreme oversold reading was the first signal that the selling had reached exhaustion levels, setting the stage for the eventual base formation.
The third act — February through June 2026 — is where the most compelling technical story unfolds. Price constructed a broad rounded bottom in the green shaded zone ($65–$80), with both EMAs flattening and beginning to converge. A blue curved line visible on the chart traces the arc of this cup formation — one of the most reliable bottoming structures in technical analysis. The dashed horizontal line within the base zone marks the equilibrium level (~$73–$75) around which price oscillated during the accumulation phase. The most recent earnings catalyst in April 2026 detonated the breakout above $80, launching HOOD into its current recovery phase with the EMA-20 now rising above the EMA-50 in a fresh bullish crossover configuration.
Moving Averages and Momentum
With the EMA-20 at $83.28 and the EMA-50 at $81.50, both rising and in bullish order below the current price of $88.47, the dynamic moving average structure is the most constructive it has been since the stock was trading near its November 2025 peak. The $81.50–$83.28 zone now represents a meaningful support cluster — a confluence of both EMAs that any healthy pullback should respect if the bullish structure is to remain intact.
RSI at 57.26 — with the signal line at 55.09 — sits in a constructive mid-range zone that offers the most important characteristic for a trending stock: room to run. Unlike RSI readings near 70–75 that signal approaching overbought conditions, a reading in the mid-50s suggests momentum is healthy and building without yet attracting the kind of speculative excess that invites sharp reversals. The RSI trajectory since the February lows — making a series of higher lows from ~20 to the current ~57 — is one of the cleanest momentum recovery signatures on the chart.
Key Levels and Outlook
The immediate resistance lies at $90–$92, the intraday high zone from recent sessions, followed by the more significant $95–$100 area representing prior support from the December 2025 decline. On the downside, the $81.50–$83.28 EMA confluence is the first meaningful support, with the base breakout level of $80 as the line that must hold to preserve the bullish thesis. A close below $80 on heavy volume would be the first technical warning that the breakout has failed.
The broader picture for HOOD is one of a stock that has constructed a legitimate multi-month base after a severe decline, broken above it with conviction on a fundamental catalyst, and is now building a series of higher highs and higher lows above both rising EMAs — the hallmark of an early-stage recovery in a high-beta fintech name with significant room to recover toward its prior highs.


 Please wait processing your request...