 CA
 NZ
 UK
 AU
 IND

 US


…
Bionano Genomics, Inc., together with its subsidiaries, provides genome analysis solutions in the Americas, Europe, the Middle East, Africa, and the Asia Pacific. The company offers genome analysis software that enables genomics labs to analyze and interpret data across a range of platforms to generate informative data visualizations for streamlined and simple reporting of causal variants. It also provides Saphyr and Stratys systems, which are sample-to-result solutions for structural variation analysis by optical genome mapping for genome analysis and understanding of genetic variation and function; Saphyr and Stratys instruments, which are single-molecule imagers; Saphyr Chip, a consumable that packages the nanochannel arrays for DNA linearization; Bionano Prep Kits and DNA labeling kits, which provide the reagents and protocols for extracting and labeling ultra-high molecular weight DNA; and Ionic purification system, which isolates and purifies nucleic acid molecules. In addition, the company offers Saphyr, Stratys, and Bionano compute servers; and VIA software, which offers one solution for analysis and interpretation of genomic data from microarray and sequencing data for cytogenetics and molecular genetics. Further, it provides testing and laboratory services comprising FirstStepDx PLUS, a chromosomal microarray for identifying an underlying genetic cause in individuals with autism spectrum disorder, developmental delay, and intellectual disability; Fragile X syndrome (FXS) testing services; NextStepDx PLUS, a exome sequencing test to identify genetic variants that are associated with disorders of childhood development; OGM-Dx HemeOne testing; OGM-Dx FSHD, a test for individuals suspected of having FSHD type 1; and OGM-Dx Postnatal Whole Genome SV and OGM-Dx Prenatal Whole Genome SV for comprehensive testing. Bionano Genomics, Inc. was founded in 2003 and is headquartered in San Diego, California.
Source: TradingView
The charts and visual representations are sourced from TradingView through embedded widgets. For any issues with chart display, please visit the TradingView website
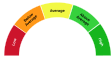
A unique technical analysis driven score developed by Kalkine showing momentum in stock prices based on select technical indicators identified.
Bionano Genomics develops optical genome-mapping systems, consumables and analysis software to detect structural variants for research and clinical use in areas like rare disease and oncology. Long-term growth may be driven by wider clinical adoption, an expanding installed base with recurring consumable sales, and progress on regulatory and reimbursement pathways that could support clinical uptake.
Key risks include ongoing operating losses and cash burn that may require financing, execution and adoption risk versus established sequencing and cytogenetics competitors, and regulatory and reimbursement uncertainty that could constrain clinical adoption.

Note: The summary and risk score provided above is created by AI and should not be construed as a recommendation of Kalkine.


| Breakdown | 2025-12-31 | 2024-12-31 | 2023-12-31 | 2022-12-31 | 2021-12-31 |
|---|---|---|---|---|---|
| Type | yearly | yearly | yearly | yearly | yearly |
| Date | 2025-12-31 | 2024-12-31 | 2023-12-31 | 2022-12-31 | 2021-12-31 |
| Income before tax | -26.33M | -111.98M | -232.43M | -130.71M | -78.15M |
| Net income | -26.39M | -112.02M | -232.49M | -132.60M | -72.44M |
| Selling general administrative | 35.15M | 51.85M | 93.50M | 88.60M | 58.49M |
| Gross profit | 6.26M | 0.38M | 9.57M | 5.95M | 3.87M |
| Reconciled depreciation | 9.73M | 14.23M | 13.91M | 9.84M | 3.37M |
| Ebit | -33.34M | -111.69M | -227.31M | -131.70M | -77.10M |
| Ebitda | -23.61M | -97.47M | -213.60M | -130.41M | -76.92M |
| Depreciation and amortization | 9.73M | 14.23M | 13.71M | 1.28M | 0.18M |
| Non operating income net other | - | - | - | -0.22M | -0.36M |
| Operating income | -33.34M | -103.98M | -215.25M | -131.70M | -77.10M |
| Other operating expenses | 61.85M | 134.76M | 251.36M | 159.50M | 95.08M |
| Interest expense | 0.30M | 0.29M | 5.12M | 0.30M | 0.93M |
| Tax provision | 0.07M | 0.03M | 0.06M | 1.88M | -5.72M |
| Interest income | 4.89M | 2.10M | 3.31M | 1.51M | 0.24M |
| Net interest income | 4.60M | -1.82M | -1.81M | 1.21M | -0.69M |
| Income tax expense | 0.07M | 0.03M | 0.06M | 1.88M | -5.72M |
| Total revenue | 28.51M | 30.78M | 36.12M | 27.80M | 17.98M |
| Total operating expenses | 39.60M | 104.36M | 224.81M | 137.64M | 80.97M |
| Cost of revenue | 22.25M | 30.40M | 26.55M | 21.86M | 14.11M |
| Total other income expense net | 7.01M | -8.00M | -17.19M | 0.99M | -1.05M |
| Net income from continuing ops | -26.39M | -112.02M | -232.49M | -132.60M | -72.44M |
| Net income applicable to common shares | - | - | - | -132.60M | -72.44M |
| Breakdown | 2025-12-31 | 2024-12-31 | 2023-12-31 | 2022-12-31 | 2021-12-31 |
|---|---|---|---|---|---|
| Type | yearly | yearly | yearly | yearly | yearly |
| Date | 2025-12-31 | 2024-12-31 | 2023-12-31 | 2022-12-31 | 2021-12-31 |
| Total assets | 73.58M | 76.67M | 214.40M | 307.50M | 377.10M |
| Intangible assets | 4.34M | 9.71M | 33.97M | 41.14M | 26.84M |
| Other current assets | 21.48M | 14.12M | 5.68M | 7.33M | 4.48M |
| Total liab | 29.16M | 41.30M | 118.25M | 58.10M | 39.98M |
| Total stockholder equity | 44.42M | 35.38M | 96.16M | 249.40M | 337.12M |
| Deferred long term liab | - | - | - | 0.13M | 0.15M |
| Other current liab | 16.41M | 4.91M | 8.09M | 19.93M | 9.69M |
| Common stock | 0.00M | - | 0.01M | 0.03M | 0.03M |
| Capital stock | 0.00M | 0.00M | 0.01M | 0.03M | 0.03M |
| Retained earnings | -719.62M | -693.23M | -581.21M | -348.71M | -216.12M |
| Other liab | - | - | - | 13.10M | 9.21M |
| Good will | - | - | 0.00M | 77.29M | 56.16M |
| Other assets | - | - | - | 2.81M | 0.75M |
| Cash | 2.99M | 9.17M | 53.06M | 5.09M | 24.57M |
| Total current liabilities | 22.94M | 37.34M | 100.03M | 35.88M | 21.84M |
| Current deferred revenue | - | 1.13M | 0.78M | 0.87M | 0.68M |
| Net debt | 3.92M | 18.12M | 34.88M | 6.58M | -13.88M |
| Short term debt | 0.95M | 23.61M | 80.77M | 2.54M | 1.77M |
| Short long term debt | - | - | 69.80M | - | - |
| Short long term debt total | 6.92M | 27.30M | 87.95M | 11.67M | 10.70M |
| Other stockholder equity | 764.03M | 728.57M | 677.34M | 599.21M | 553.75M |
| Property plant equipment | - | - | - | 18.03M | 10.32M |
| Total current assets | 45.39M | 39.49M | 140.12M | 157.30M | 272.41M |
| Net tangible assets | - | - | - | 172.11M | 337.12M |
| Short term investments | 10.27M | 0.30M | 48.82M | 108.09M | 226.04M |
| Net receivables | 5.20M | 4.77M | 9.66M | 7.02M | 4.93M |
| Inventory | 5.45M | 11.12M | 22.89M | 29.76M | 12.39M |
| Accounts payable | 5.59M | 6.96M | 10.38M | 12.53M | 9.70M |
| Accumulated other comprehensive income | 0.02M | 0.03M | 0.02M | -1.12M | -0.54M |
| Common stock total equity | - | - | - | 0.03M | 0.03M |
| Retained earnings total equity | - | - | - | -348.71M | -216.12M |
| Non currrent assets other | 2.69M | 3.15M | 7.43M | 2.81M | 0.75M |
| Non current assets total | 28.20M | 37.18M | 74.29M | 150.20M | 104.69M |
| Capital lease obligations | 6.92M | 6.93M | 9.61M | 11.67M | 10.70M |
| Breakdown | 2025-12-31 | 2024-12-31 | 2023-12-31 | 2022-12-31 | 2021-12-31 |
|---|---|---|---|---|---|
| Type | yearly | yearly | yearly | yearly | yearly |
| Date | 2025-12-31 | 2024-12-31 | 2023-12-31 | 2022-12-31 | 2021-12-31 |
| Investments | -12.75M | 73.84M | 24.16M | 116.69M | -226.91M |
| Change to liabilities | - | - | - | 2.31M | 10.74M |
| Total cashflows from investing activities | -12.75M | 73.84M | 24.16M | 82.77M | -278.06M |
| Net borrowings | -4.95M | -48.06M | 70.95M | -0.04M | -15.00M |
| Total cash from financing activities | 24.04M | -13.69M | 113.81M | 23.01M | 336.11M |
| Change to operating activities | - | - | - | -3.96M | 1.99M |
| Net income | -26.39M | -112.02M | -232.49M | -132.60M | -72.44M |
| Change in cash | -5.06M | -8.78M | 12.86M | -19.08M | -13.88M |
| Begin period cash flow | 9.57M | 18.35M | 5.49M | 24.57M | 38.45M |
| End period cash flow | 4.51M | 9.57M | 18.35M | 5.49M | 24.57M |
| Total cash from operating activities | -16.34M | -68.92M | -125.18M | -124.82M | -71.93M |
| Issuance of capital stock | 31.10M | 44.43M | 57.70M | 23.13M | 342.71M |
| Depreciation | 9.73M | 14.23M | 13.91M | 9.84M | 3.37M |
| Other cashflows from investing activities | - | - | - | -33.13M | -50.52M |
| Change to inventory | 4.92M | -0.59M | -4.15M | -23.68M | -15.93M |
| Change to account receivables | -0.45M | 4.14M | -2.30M | -2.90M | -0.49M |
| Sale purchase of stock | - | - | - | 22.89M | 351.03M |
| Other cashflows from financing activities | 24.04M | -10.06M | -14.84M | -0.09M | 8.40M |
| Change to netincome | - | - | - | 25.21M | 4.21M |
| Capital expenditures | 0.00M | 0.10M | 1.69M | 3.30M | 1.46M |
| Change receivables | - | - | - | -2.90M | -0.49M |
| Cash flows other operating | - | - | - | -3.43M | -1.70M |
| Cash and cash equivalents changes | - | - | - | -19.04M | -13.88M |
| Change in working capital | 0.51M | 4.40M | -14.77M | -28.59M | -7.65M |
| Stock based compensation | 4.53M | 9.74M | 15.18M | 22.42M | 9.72M |
| Other non cash items | -4.73M | 14.73M | 92.99M | 2.35M | 0.85M |
| Free cash flow | -16.34M | -69.03M | -126.87M | -128.12M | -73.39M |
Sector: Healthcare Industry: Medical Instruments & Supplies
|
Stock Name
|
Change
(USD) |
Price
(USD) |
Trailing
PE (x) |
Forward
PE (x) |
Price Sales
TTM (x) |
Price to Book Value (x)
|
Enterprise Value
to Revenue (x) |
Enterprise Value
to EBITDA (x) |
|---|---|---|---|---|---|---|---|---|
| BNGO Bionano Genomics Inc |
-0.09 8.19% |
1.01 | - | - | 0.49 | 0.33 | 0.08 | -0.18 |
| ISRG Intuitive Surgical Inc |
-8.88 1.97% |
440.65 | 43.30 | 31.35 | 12.25 | 7.35 | 11.63 | 30.22 |
| ESLOF EssilorLuxottica Société anonyme |
-2.56 1.26% |
200.18 | 44.84 | 27.62 | 4.07 | 2.49 | 3.71 | 16.04 |
| ESLOY Essilor International SA |
-1.98 1.94% |
99.87 | 41.68 | 27.25 | 3.94 | 2.45 | 3.71 | 16.04 |
| BDX Becton Dickinson and Company |
0.83 0.39% |
215.35 | 31.62 | 13.76 | 2.25 | 2.04 | 2.93 | 13.40 |
Bionano Genomics, Inc., together with its subsidiaries, provides genome analysis solutions in the Americas, Europe, the Middle East, Africa, and the Asia Pacific. The company offers genome analysis software that enables genomics labs to analyze and interpret data across a range of platforms to generate informative data visualizations for streamlined and simple reporting of causal variants. It also provides Saphyr and Stratys systems, which are sample-to-result solutions for structural variation analysis by optical genome mapping for genome analysis and understanding of genetic variation and function; Saphyr and Stratys instruments, which are single-molecule imagers; Saphyr Chip, a consumable that packages the nanochannel arrays for DNA linearization; Bionano Prep Kits and DNA labeling kits, which provide the reagents and protocols for extracting and labeling ultra-high molecular weight DNA; and Ionic purification system, which isolates and purifies nucleic acid molecules. In addition, the company offers Saphyr, Stratys, and Bionano compute servers; and VIA software, which offers one solution for analysis and interpretation of genomic data from microarray and sequencing data for cytogenetics and molecular genetics. Further, it provides testing and laboratory services comprising FirstStepDx PLUS, a chromosomal microarray for identifying an underlying genetic cause in individuals with autism spectrum disorder, developmental delay, and intellectual disability; Fragile X syndrome (FXS) testing services; NextStepDx PLUS, a exome sequencing test to identify genetic variants that are associated with disorders of childhood development; OGM-Dx HemeOne testing; OGM-Dx FSHD, a test for individuals suspected of having FSHD type 1; and OGM-Dx Postnatal Whole Genome SV and OGM-Dx Prenatal Whole Genome SV for comprehensive testing. Bionano Genomics, Inc. was founded in 2003 and is headquartered in San Diego, California.
| Name | Title | Year Born |
|---|---|---|
| Dr. Robert Erik Holmlin M.B.A., Ph.D. | Pres, CEO, Sec. & Director | 1968 |
| Mr. Mark Oldakowski | Chief Operating Officer | 1974 |
| Mr. Christopher P. Stewart | Chief Financial Officer | 1970 |
| Mr. Mark Adamchak CPA | VP of Accounting & Controller | NA |
| Jonathan Dixon | Global Head of Legal | NA |
| Mr. Stanislas Marin M.B.A., M.S. | Head of Global Sales | NA |
| Ms. Helene Klein | Chief People Officer | NA |
| Dr. Alka Chaubey FACMG, Ph.D. | Chief Medical Officer | 1973 |
| Dr. Soheil Shams Ph.D. | CIO of Emeritus | 1964 |
| Ms. Donna Polizio | Global Head of Market Access | NA |
Disclaimer - (*)This information, including any data, is sourced from Unicorn Data Services SAS, trading as EOD Historical Data (“EODHD”) on an ‘as is’ basis, using their API. We cannot guarantee the completeness or validity of the information and data provided on this page, as well as via the API. In some cases, the data may include analyst ratings or recommendations sourced through the EODHD API, which are intended solely for general information purposes.
This information does not consider your personal objectives, financial situation, or needs. Kalkine is not liable for any errors or omissions in the information provided or for any actions taken in reliance on it. You should seek advice from a financial adviser, stockbroker or other professional adviser (including taxation and legal advice) as necessary before acting on this information.

Download a free report with stock ideas and industry insights for general information.
Download Free Report Now →


Basic Materials
 -1.40%
Communication Services
-0.45%

Consumer Cyclical
-0.55%

Consumer Defensive
-0.01%

Energy
-0.01%

Financial Services
-0.40%
Financials
-0.15%

Healthcare
-1.15%

Industrials
-0.46%

Real Estate
-0.29%

Technology
-1.22%

Utilities
-0.10%
Note: Daily price change (%) by sector excluding stocks with +/-90% daily price change. Companies above $500 million market capitalization are considered.
 Portfolio
 Watchlist


 +0.55%
 Please wait processing your request...