 CA
 NZ
 UK
 AU
 IND

 US


…
Canterbury Park Holding Corporation, through its subsidiaries, engages in horse racing, casino, food and beverage, and real estate development businesses. The company operates year-round simulcasting of horse races, as well as wagering on live thoroughbred and quarter horse races on a seasonal basis. It offers unbanked card games, such as poker and table games. In addition, the company is involved in the operation of concession stands, restaurants and buffets, bars, and other food venues; café style restaurants and full-service bars within the Casino and simulcast area; lounge services along with a buffet restaurant; various concession style food and beverages during live racing; and catering and events services. Further, it engages in development opportunities, such as residential development, office, restaurants, hotel, entertainment, and retail operations. The company is also involved in the related services and activities, such as parking, advertising signage, publication sales, and other entertainment events and activities. The company was incorporated in 1994 and is based in Shakopee, Minnesota.
Source: TradingView
The charts and visual representations are sourced from TradingView through embedded widgets. For any issues with chart display, please visit the TradingView website
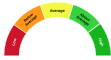
A unique technical analysis driven score developed by Kalkine showing momentum in stock prices based on select technical indicators identified.
Canterbury Park Holding Corporation operates Canterbury Park racetrack in Shakopee, Minnesota, offering live horse racing, simulcast wagering, a card room and on-site entertainment. Long-term growth may be supported by expanded gaming options, greater capture of wagering through simulcast and digital channels, and increased non-racing events and amenities as regulation evolves. Investors may find it attractive for its focused regional market position and potential for steady cash flow from diversified on-site operations.
Material risks include dependence on a single physical venue exposed to weather and seasonal demand, regulatory and competitive pressures in the gaming industry, and sensitivity to consumer discretionary spending.

Note: The summary and risk score provided above is created by AI and should not be construed as a recommendation of Kalkine.


| Breakdown | 2025-12-31 | 2024-12-31 | 2023-12-31 | 2022-12-31 | 2021-12-31 |
|---|---|---|---|---|---|
| Type | yearly | yearly | yearly | yearly | yearly |
| Date | 2025-12-31 | 2024-12-31 | 2023-12-31 | 2022-12-31 | 2021-12-31 |
| Income before tax | -0.81M | 3.04M | 14.98M | 10.23M | 15.80M |
| Net income | -0.53M | 2.11M | 10.56M | 7.51M | 11.80M |
| Selling general administrative | 32.31M | 31.80M | 31.47M | 29.13M | 19.31M |
| Selling and marketing expenses | 1.73M | 1.35M | 2.07M | 3.10M | 1.68M |
| Gross profit | 17.08M | 48.52M | 48.80M | 52.94M | 47.86M |
| Reconciled depreciation | 4.00M | 3.62M | 3.15M | 2.98M | 2.84M |
| Ebit | 2.52M | 4.75M | 5.17M | 10.89M | 17.78M |
| Ebitda | 6.52M | 8.37M | 8.31M | 14.16M | 20.10M |
| Depreciation and amortization | 4.00M | 3.62M | 3.15M | 3.27M | 2.32M |
| Non operating income net other | - | - | - | -0.66M | - |
| Operating income | 2.52M | 6.43M | 11.50M | 10.89M | 17.78M |
| Other operating expenses | 57.05M | 55.13M | 49.94M | 55.79M | 42.88M |
| Interest expense | - | - | - | 0.91M | 0.91M |
| Tax provision | -0.28M | 0.92M | 4.42M | 2.72M | 4.00M |
| Interest income | 1.97M | 2.07M | 1.98M | 0.91M | 0.72M |
| Net interest income | 1.97M | 2.07M | 1.98M | 0.91M | 0.72M |
| Income tax expense | -0.28M | 0.92M | 4.42M | 2.72M | 4.00M |
| Total revenue | 59.57M | 61.56M | 61.44M | 66.82M | 60.40M |
| Total operating expenses | 14.56M | 42.09M | 37.30M | 41.90M | 30.35M |
| Cost of revenue | 42.49M | 13.04M | 12.63M | 13.88M | 12.54M |
| Total other income expense net | -3.33M | -3.40M | 3.48M | -0.66M | -1.98M |
| Net income from continuing ops | -0.53M | 2.11M | 10.56M | 7.51M | 11.80M |
| Net income applicable to common shares | - | - | - | 7.51M | 11.80M |
| Breakdown | 2025-12-31 | 2024-12-31 | 2023-12-31 | 2022-12-31 | 2021-12-31 |
|---|---|---|---|---|---|
| Type | yearly | yearly | yearly | yearly | yearly |
| Date | 2025-12-31 | 2024-12-31 | 2023-12-31 | 2022-12-31 | 2021-12-31 |
| Total assets | 113.40M | 110.26M | 104.98M | 92.28M | 83.06M |
| Other current assets | 1.18M | 5.46M | 0.65M | 0.01M | 4.31M |
| Total liab | 29.52M | 25.83M | 23.19M | 21.09M | 18.71M |
| Total stockholder equity | 83.88M | 84.09M | 81.80M | 71.19M | 64.35M |
| Deferred long term liab | - | - | - | 7.47M | - |
| Other current liab | 6.83M | 5.59M | 6.18M | 6.63M | 6.72M |
| Common stock | 0.05M | 0.05M | 0.05M | 0.05M | 0.05M |
| Capital stock | 0.05M | 0.05M | 0.05M | 0.05M | 0.05M |
| Retained earnings | 53.14M | 55.10M | 54.40M | 45.22M | 39.41M |
| Other liab | - | - | - | 10.66M | 8.88M |
| Other assets | - | 0.18M | 0.16M | 18.22M | 17.89M |
| Cash | 15.82M | 10.08M | 25.84M | 12.99M | 11.87M |
| Total current liabilities | 9.63M | 10.67M | 11.08M | 10.43M | 9.81M |
| Current deferred revenue | 0.54M | 0.31M | 0.27M | 0.41M | 0.73M |
| Net debt | -15.71M | -9.90M | -25.78M | -12.97M | -11.80M |
| Short term debt | 0.04M | 0.06M | 0.03M | 0.02M | 0.05M |
| Short long term debt total | 0.12M | 0.18M | 0.06M | 0.02M | 0.07M |
| Other stockholder equity | 30.69M | 28.94M | 27.35M | 25.91M | 24.89M |
| Property plant equipment | - | - | - | 36.49M | 34.38M |
| Total current assets | 25.04M | 24.41M | 36.30M | 30.70M | 24.39M |
| Long term investments | 5.16M | 6.98M | 6.61M | 22.71M | 6.39M |
| Net tangible assets | - | - | - | 71.19M | 64.35M |
| Short term investments | 5.00M | 5.00M | 5.00M | 5.00M | - |
| Net receivables | 2.77M | 3.63M | 4.57M | 8.77M | 7.97M |
| Inventory | 0.27M | 0.25M | 0.25M | 0.26M | 0.25M |
| Accounts payable | 2.22M | 3.67M | 4.60M | 3.37M | 2.31M |
| Common stock total equity | - | - | - | 0.05M | - |
| Retained earnings total equity | - | - | - | 45.22M | - |
| Non currrent assets other | 55.16M | 27.46M | 0.01M | 18.22M | 17.89M |
| Non current assets total | 88.36M | 85.85M | 68.68M | 61.58M | 58.67M |
| Capital lease obligations | 0.12M | 0.18M | 0.06M | 0.02M | 0.07M |
| Breakdown | 2025-12-31 | 2024-12-31 | 2023-12-31 | 2022-12-31 | 2021-12-31 |
|---|---|---|---|---|---|
| Type | yearly | yearly | yearly | yearly | yearly |
| Date | 2025-12-31 | 2024-12-31 | 2023-12-31 | 2022-12-31 | 2021-12-31 |
| Investments | 0.00M | -17.35M | -0.46M | -5.44M | -2.50M |
| Change to liabilities | - | - | - | 0.52M | -0.60M |
| Total cashflows from investing activities | -5.45M | -17.39M | -0.46M | -9.27M | -2.50M |
| Net borrowings | -0.03M | -0.03M | -0.02M | -0.03M | -0.03M |
| Total cash from financing activities | -1.31M | -1.29M | -1.35M | -1.44M | 0.13M |
| Change to operating activities | - | - | - | -1.02M | -7.02M |
| Net income | -0.53M | 2.11M | 10.56M | 7.51M | 11.80M |
| Change in cash | 2.14M | -12.15M | 9.74M | 0.51M | 11.13M |
| Begin period cash flow | 13.69M | 25.84M | 16.11M | 15.60M | 4.47M |
| End period cash flow | 15.82M | 13.69M | 25.84M | 16.11M | 15.60M |
| Total cash from operating activities | 8.90M | 6.52M | 11.54M | 11.22M | 13.50M |
| Issuance of capital stock | 0.21M | 0.25M | 0.23M | 0.16M | 0.18M |
| Depreciation | 4.00M | 3.62M | 3.15M | 2.98M | 2.84M |
| Other cashflows from investing activities | -1.27M | -5.46M | 7.45M | 1.16M | -0.64M |
| Dividends paid | 1.43M | 1.41M | 1.38M | -1.36M | -0.00M |
| Change to inventory | -0.15M | -1.23M | -0.02M | 0.04M | -7.02M |
| Change to account receivables | -0.56M | -0.64M | -2.57M | -0.23M | -0.16M |
| Sale purchase of stock | - | - | -0.17M | 0.16M | - |
| Other cashflows from financing activities | -0.06M | -0.11M | -0.17M | -0.21M | -0.03M |
| Change to netincome | - | - | - | 1.82M | 3.87M |
| Capital expenditures | 4.18M | 11.98M | 7.91M | 5.00M | 3.78M |
| Change receivables | - | - | - | -0.23M | - |
| Cash flows other operating | - | - | - | -1.39M | - |
| Cash and cash equivalents changes | - | - | - | 0.51M | - |
| Change in working capital | -2.09M | -4.02M | 1.46M | -1.86M | -5.01M |
| Stock based compensation | 1.60M | 1.45M | 1.38M | 1.07M | 1.11M |
| Other non cash items | 5.30M | 5.27M | -7.83M | 1.71M | 2.44M |
| Free cash flow | 4.72M | -5.46M | 3.63M | 6.22M | 9.72M |
Sector: Consumer Cyclical Industry: Resorts & Casinos
|
Stock Name
|
Change
(USD) |
Price
(USD) |
Trailing
PE (x) |
Forward
PE (x) |
Price Sales
TTM (x) |
Price to Book Value (x)
|
Enterprise Value
to Revenue (x) |
Enterprise Value
to EBITDA (x) |
|---|---|---|---|---|---|---|---|---|
| CPHC Canterbury Park Holding Corporation |
-0.17 1.06% |
15.73 | - | 20.08 | 1.35 | 0.96 | 1.07 | 9.78 |
| LVS Las Vegas Sands Corp |
- -% |
39.33 | 16.00 | 11.98 | 1.95 | 47.27 | 2.87 | 8.52 |
| GXYEF Galaxy Entertainment Group Ltd |
- -% |
4.33 | 14.06 | 11.70 | 0.38 | 1.58 | 2.49 | 8.34 |
| GXYYY Galaxy Entertainment Group Ltd ADR |
0.06 0.29% |
20.87 | 13.33 | 12.64 | 0.36 | 1.71 | 2.49 | 8.34 |
| SCHYF Sands China Ltd |
- -% |
1.35 | 16.30 | 12.21 | 1.90 | 10.75 | 2.43 | 9.56 |
Canterbury Park Holding Corporation, through its subsidiaries, engages in horse racing, casino, food and beverage, and real estate development businesses. The company operates year-round simulcasting of horse races, as well as wagering on live thoroughbred and quarter horse races on a seasonal basis. It offers unbanked card games, such as poker and table games. In addition, the company is involved in the operation of concession stands, restaurants and buffets, bars, and other food venues; café style restaurants and full-service bars within the Casino and simulcast area; lounge services along with a buffet restaurant; various concession style food and beverages during live racing; and catering and events services. Further, it engages in development opportunities, such as residential development, office, restaurants, hotel, entertainment, and retail operations. The company is also involved in the related services and activities, such as parking, advertising signage, publication sales, and other entertainment events and activities. The company was incorporated in 1994 and is based in Shakopee, Minnesota.

1100 Canterbury Road, Shakopee, MN, United States, 55379

952 445 7223

214
| Name | Title | Year Born |
|---|---|---|
| Mr. Randall D. Sampson CPA | Co-Founder, Exec. Chairman, Pres, CEO, GM, Treasurer | 1958 |
| Mr. Dale H. Schenian | Co-Founder & Vice Chairman Emeritus | 1942 |
| Mr. Randy James Dehmer | CFO, Sr. VP of Fin. & Sec. | 1983 |
| Jeff Maday | Media Relations Mang. | NA |
| Mr. John A. Groen | VP of Marketing | 1978 |
| Ms. Mary B. Fleming | VP of HR | 1966 |
| Mr. Michael J. Garin | VP of Non-Gaming Operations and Assistant Sec. | 1956 |
| Mr. Mark A. Erickson | VP of Facilities | 1957 |
| Mr. Michael Hochman | VP of Casino Card Operations | 1966 |
| Mr. Randall D. Sampson CPA | Co-Founder, Executive Chairman, President, CEO, GM, Treasurer | 1959 |
Disclaimer - (*)This information, including any data, is sourced from Unicorn Data Services SAS, trading as EOD Historical Data (“EODHD”) on an ‘as is’ basis, using their API. We cannot guarantee the completeness or validity of the information and data provided on this page, as well as via the API. In some cases, the data may include analyst ratings or recommendations sourced through the EODHD API, which are intended solely for general information purposes.
This information does not consider your personal objectives, financial situation, or needs. Kalkine is not liable for any errors or omissions in the information provided or for any actions taken in reliance on it. You should seek advice from a financial adviser, stockbroker or other professional adviser (including taxation and legal advice) as necessary before acting on this information.

Download a free report with stock ideas and industry insights for general information.
Download Free Report Now →


Basic Materials
 -1.14%
Communication Services
-1.25%

Consumer Cyclical
-1.10%

Consumer Defensive
-0.88%

Energy
-0.75%

Financial Services
-0.95%
Financials
-0.37%

Healthcare
-0.71%

Industrials
-0.76%

Real Estate
-0.66%

Technology
-1.57%

Utilities
-0.40%
Note: Daily price change (%) by sector excluding stocks with +/-90% daily price change. Companies above $500 million market capitalization are considered.
 Portfolio
 Watchlist


 +-%
 Please wait processing your request...