 CA
 NZ
 UK
 AU
 IND

 US


…
Robinhood Markets, Inc. operates financial services platform in the United States. The company's platform allows users to invest in stocks, exchange-traded funds (ETFs), and American depository receipts. It offers fractional trading, recurring investments, access to investing on margin, fully-paid securities lending, cash sweep, instant withdrawals, retirement program, around-the-clock trading, joint investing accounts, event contracts, future contract services, and short selling. The company also provides various learning and education solutions comprise Snacks, an accessible digest of business news stories for a new generation of investors; Learn, which is an online collection of guides, feature tutorials, and financial dictionary; Newsfeeds that offer access to free, premium news from sites from various sites, such as Barron's, Reuters, and Dow Jones. In addition, the company offers In-App Education, a resource that covers investing fundamentals, including why people invest, a stock market overview, and tips on how to define investing goals, as well as allows customers to understand the basics of investing before their first trade; and Crypto Learn and Earn, an educational module available to various crypto customers through Robinhood Learn to teach customers the basics related to cryptocurrency. Further, it provides Robinhood credit cards, cash card and spending accounts, and wallets. Robinhood Markets, Inc. was incorporated in 2013 and is headquartered in Menlo Park, California.
Source: TradingView
The charts and visual representations are sourced from TradingView through embedded widgets. For any issues with chart display, please visit the TradingView website
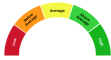
A unique technical analysis driven score developed by Kalkine showing momentum in stock prices based on select technical indicators identified.
Robinhood Markets operates a retail brokerage and financial-services platform that offers commission-free stock and options trading, cash management and cryptocurrency services primarily through its mobile app. Long-term growth may come from user and engagement expansion, higher revenue per user via subscriptions, interest income and crypto adoption, and the company's low-cost brand appears positioned to attract cost-conscious retail investors.
Principal risks include regulatory and legal scrutiny of payment-for-order-flow and market conduct, dependence on trading activity for revenue, and strong competitive pressure that could hinder growth.

Note: The summary and risk score provided above is created by AI and should not be construed as a recommendation of Kalkine.


| Breakdown | 2025-12-31 | 2024-12-31 | 2023-12-31 | 2022-12-31 | 2021-12-31 |
|---|---|---|---|---|---|
| Type | yearly | yearly | yearly | yearly | yearly |
| Date | 2025-12-31 | 2024-12-31 | 2023-12-31 | 2022-12-31 | 2021-12-31 |
| Income before tax | 2108.00M | 1064.00M | -533.00M | -1027.00M | -3684.43M |
| Net income | 1883.00M | 1411.00M | -541.00M | -1028.00M | -3686.43M |
| Selling general administrative | 227.00M | 132.00M | 1169.00M | 924.00M | 1370.52M |
| Selling and marketing expenses | 349.00M | 231.00M | 122.00M | 103.00M | 327.37M |
| Gross profit | 3728.00M | 2344.00M | 1719.00M | 1179.00M | 1662.80M |
| Reconciled depreciation | 86.00M | 77.00M | 71.00M | 61.00M | 25.50M |
| Ebit | 2094.00M | 1054.00M | -536.00M | -1011.00M | -1641.01M |
| Ebitda | 2180.00M | 1131.00M | -465.00M | -950.00M | -1615.51M |
| Depreciation and amortization | 86.00M | 77.00M | 71.00M | 61.00M | 25.50M |
| Non operating income net other | - | - | - | - | 2.23M |
| Operating income | 2094.00M | 1054.00M | -536.00M | -1011.00M | -1641.01M |
| Other operating expenses | 2379.00M | 1897.00M | 2401.00M | 2369.00M | 3456.15M |
| Interest expense | - | 24.00M | 23.00M | 16.00M | 2043.43M |
| Tax provision | 225.00M | -347.00M | 7.00M | 1.00M | 2.00M |
| Income tax expense | 225.00M | -347.00M | 8.00M | 1.00M | 2.00M |
| Total revenue | 4473.00M | 2951.00M | 1865.00M | 1358.00M | 1815.14M |
| Total operating expenses | 1634.00M | 1290.00M | 2255.00M | 2190.00M | 3303.80M |
| Cost of revenue | 745.00M | 607.00M | 146.00M | 179.00M | 152.34M |
| Total other income expense net | 14.00M | 10.00M | 3.00M | -16.00M | -2043.43M |
| Net income from continuing ops | 1883.00M | 1411.00M | -737.00M | -1028.00M | -3686.43M |
| Net income applicable to common shares | - | - | - | -1028.00M | -3686.43M |
| Breakdown | 2025-12-31 | 2024-12-31 | 2023-12-31 | 2022-12-31 | 2021-12-31 |
|---|---|---|---|---|---|
| Type | yearly | yearly | yearly | yearly | yearly |
| Date | 2025-12-31 | 2024-12-31 | 2023-12-31 | 2022-12-31 | 2021-12-31 |
| Total assets | 38137.00M | 26187.00M | 32332.00M | 23337.00M | 19769.18M |
| Intangible assets | 168.00M | 38.00M | 48.00M | 25.00M | 34.11M |
| Other current assets | 7434.00M | 5897.00M | -11669.00M | 9500.00M | 1955.31M |
| Total liab | 28986.00M | 18215.00M | 25636.00M | 16381.00M | 12476.09M |
| Total stockholder equity | 9140.00M | 7972.00M | 6696.00M | 6956.00M | 7293.09M |
| Other current liab | 16682.00M | 10244.00M | 16517.00M | 14234.00M | 1968.27M |
| Common stock | - | - | - | - | 0.09M |
| Capital stock | 0.00M | 0.00M | 0.00M | 0.00M | 0.09M |
| Retained earnings | -2152.00M | -4035.00M | -5446.00M | -4905.00M | -3876.53M |
| Other liab | - | - | - | 1.00M | 128.75M |
| Good will | 385.00M | 179.00M | 175.00M | 100.00M | 100.52M |
| Other assets | - | 26187.00M | 27154.00M | 57.00M | 204.59M |
| Cash | 4261.00M | 4332.00M | 4881.00M | 6339.00M | 6253.48M |
| Total current liabilities | 28771.00M | 18104.00M | 25545.00M | 16253.00M | 12347.34M |
| Current deferred revenue | - | - | 3485.00M | 17.00M | 6475.73M |
| Net debt | 7365.00M | 3131.00M | 367.00M | -4505.00M | -2602.44M |
| Short term debt | 11626.00M | 7463.00M | 5159.00M | 1834.00M | 3651.03M |
| Short long term debt | 11626.00M | 7463.00M | 3547.00M | 1834.00M | 3651.03M |
| Short long term debt total | 11626.00M | 7463.00M | 5248.00M | 1834.00M | 3651.03M |
| Other stockholder equity | 11284.00M | 12008.00M | 12145.00M | 11861.00M | 11169.14M |
| Property plant equipment | - | - | - | 238.00M | 146.42M |
| Total current assets | 36305.00M | 25103.00M | 31790.00M | 22917.00M | 19283.54M |
| Long term investments | - | 0.00M | 73.00M | - | - |
| Net tangible assets | - | - | - | 6831.00M | 7158.46M |
| Short term investments | 6190.00M | 6164.00M | 1602.00M | 517.00M | 27.19M |
| Net receivables | 18420.00M | 8710.00M | 5186.00M | 3294.00M | 6727.23M |
| Inventory | - | - | - | 3267.00M | 4320.34M |
| Accounts payable | 463.00M | 397.00M | 384.00M | 185.00M | 252.31M |
| Accumulated other comprehensive income | 8.00M | -1.00M | -3.00M | - | 0.41M |
| Common stock total equity | - | - | - | - | 0.09M |
| Retained earnings total equity | - | - | - | - | -3876.53M |
| Non currrent assets other | 1125.00M | 728.00M | 20004.00M | 149.00M | 204.59M |
| Non current assets total | 1832.00M | 1084.00M | 542.00M | 420.00M | 485.64M |
| Breakdown | 2025-12-31 | 2024-12-31 | 2023-12-31 | 2022-12-31 | 2021-12-31 |
|---|---|---|---|---|---|
| Type | yearly | yearly | yearly | yearly | yearly |
| Date | 2025-12-31 | 2024-12-31 | 2023-12-31 | 2022-12-31 | 2021-12-31 |
| Investments | 156.00M | -148.00M | -568.00M | -60.00M | -27.20M |
| Change to liabilities | - | - | - | -62.00M | 134.09M |
| Total cashflows from investing activities | 141.00M | -148.00M | - | -60.00M | -237.88M |
| Net borrowings | 468.00M | 131.00M | - | - | 3551.97M |
| Total cash from financing activities | -590.00M | -345.00M | 1103.00M | -43.00M | 5203.42M |
| Change to operating activities | - | - | - | -605.00M | -1088.37M |
| Net income | 1883.00M | 1411.00M | -541.00M | -1028.00M | -3686.43M |
| Change in cash | 1198.00M | -651.00M | -1504.00M | -913.00M | 4080.70M |
| Begin period cash flow | 8695.00M | 9346.00M | 6339.00M | 10270.00M | 6189.66M |
| End period cash flow | 9893.00M | 8695.00M | 4835.00M | 9357.00M | 10270.36M |
| Total cash from operating activities | 1638.00M | -157.00M | 553.00M | -852.00M | -884.77M |
| Issuance of capital stock | - | - | 0.00M | 0.00M | 2052.38M |
| Depreciation | 86.00M | 77.00M | 71.00M | 61.00M | 25.50M |
| Other cashflows from investing activities | -794.00M | -227.00M | - | -20.00M | -1.60M |
| Dividends paid | - | - | - | - | 7.34M |
| Change to inventory | - | - | - | - | 2138.51M |
| Change to account receivables | -8216.00M | -6608.00M | -311.00M | 3398.00M | -3325.70M |
| Sale purchase of stock | -653.00M | -257.00M | -608.00M | 16.00M | 7.34M |
| Other cashflows from financing activities | -426.00M | -219.00M | 6801.00M | -44.00M | 5119.31M |
| Change to netincome | - | - | - | 779.00M | 3694.27M |
| Capital expenditures | 54.00M | 50.00M | 21.00M | 57.00M | 83.65M |
| Change receivables | - | - | - | - | -3325.70M |
| Cash flows other operating | - | - | - | - | 1889.24M |
| Cash and cash equivalents changes | - | - | - | - | 4080.77M |
| Change in working capital | -934.00M | -1656.00M | 101.00M | -655.00M | -918.11M |
| Stock based compensation | 305.00M | 304.00M | 871.00M | 654.00M | 1570.39M |
| Other non cash items | 117.00M | 76.00M | 845.00M | 116.00M | 2045.55M |
| Free cash flow | 1584.00M | -207.00M | 532.00M | -909.00M | -968.43M |
Sector: Financial Services Industry: Capital Markets
|
Stock Name
|
Change
(USD) |
Price
(USD) |
Trailing
PE (x) |
Forward
PE (x) |
Price Sales
TTM (x) |
Price to Book Value (x)
|
Enterprise Value
to Revenue (x) |
Enterprise Value
to EBITDA (x) |
|---|---|---|---|---|---|---|---|---|
| HOOD Robinhood Markets Inc |
-3.13 3.31% |
91.43 | 50.43 | 41.84 | 20.13 | 10.84 | 22.17 | 46.31 |
| GS Goldman Sachs Group Inc |
13.40 1.47% |
925.17 | 17.21 | 16.00 | 4.47 | 2.26 | 11.15 | - |
| SCHW Charles Schwab Corp |
-0.54 0.60% |
88.76 | 19.53 | 13.89 | 7.16 | 4.22 | 8.80 | - |
| MS Morgan Stanley |
3.22 1.72% |
190.13 | 16.50 | 13.76 | 2.80 | 1.65 | - | - |
| IBKR Interactive Brokers Group Inc |
1.29 1.57% |
83.54 | 35.95 | 27.93 | 22.14 | 6.96 | 3.01 | 3.37 |
Robinhood Markets, Inc. operates financial services platform in the United States. The company's platform allows users to invest in stocks, exchange-traded funds (ETFs), and American depository receipts. It offers fractional trading, recurring investments, access to investing on margin, fully-paid securities lending, cash sweep, instant withdrawals, retirement program, around-the-clock trading, joint investing accounts, event contracts, future contract services, and short selling. The company also provides various learning and education solutions comprise Snacks, an accessible digest of business news stories for a new generation of investors; Learn, which is an online collection of guides, feature tutorials, and financial dictionary; Newsfeeds that offer access to free, premium news from sites from various sites, such as Barron's, Reuters, and Dow Jones. In addition, the company offers In-App Education, a resource that covers investing fundamentals, including why people invest, a stock market overview, and tips on how to define investing goals, as well as allows customers to understand the basics of investing before their first trade; and Crypto Learn and Earn, an educational module available to various crypto customers through Robinhood Learn to teach customers the basics related to cryptocurrency. Further, it provides Robinhood credit cards, cash card and spending accounts, and wallets. Robinhood Markets, Inc. was incorporated in 2013 and is headquartered in Menlo Park, California.
| Name | Title | Year Born |
|---|---|---|
| Mr. Vladimir Tenev | Co-Founder, Pres, CEO & Chairman | 1987 |
| Mr. Baiju Prafulkumar Bhatt | Co-Founder, Chief Creative Officer & Director | 1985 |
| Mr. Jason Warnick | Chief Financial Officer | 1972 |
| Ms. Gretchen Howard | Chief Operating Officer | 1973 |
| Irvin Sha | Head of Investor Relations & Capital Markets | NA |
| Mr. Daniel M. Gallagher Jr. | Chief Legal, Compliance, and Corp. Affairs Officer | 1973 |
| Mr. Alex Mesa | Head of Customer Experience | NA |
| Ms. Mary Elizabeth Taylor | VP & Head of External Affairs | NA |
| Ms. Christina Y. Lai Esq. | VP, Deputy Gen. Counsel & Sec. | NA |
| Mr. Chris Koegel | VP of Investor Relations | NA |
Disclaimer - (*)This information, including any data, is sourced from Unicorn Data Services SAS, trading as EOD Historical Data (“EODHD”) on an ‘as is’ basis, using their API. We cannot guarantee the completeness or validity of the information and data provided on this page, as well as via the API. In some cases, the data may include analyst ratings or recommendations sourced through the EODHD API, which are intended solely for general information purposes.
This information does not consider your personal objectives, financial situation, or needs. Kalkine is not liable for any errors or omissions in the information provided or for any actions taken in reliance on it. You should seek advice from a financial adviser, stockbroker or other professional adviser (including taxation and legal advice) as necessary before acting on this information.

Download a free report with stock ideas and industry insights for general information.
Download Free Report Now →


Basic Materials
 +0.02%
Communication Services
 -0.63%

Consumer Cyclical
-0.11%

Consumer Defensive
-0.45%

Energy
+0.39%

Financial Services
-0.10%
Financials
-0.81%

Healthcare
+1.03%

Industrials
+0.32%

Real Estate
-0.31%

Technology
+0.59%

Utilities
-0.18%
Note: Daily price change (%) by sector excluding stocks with +/-90% daily price change. Companies above $500 million market capitalization are considered.
 Portfolio
 Watchlist


 Please wait processing your request...