 CA
 NZ
 UK
 AU
 IND

 US


…
National Energy Services Reunited Corp. provides oilfield services in the Middle East and North Africa. The company's Production Services segment offers hydraulic fracturing services; coiled tubing services, including nitrogen lifting, fishing, milling, clean-out, scale removal, and other well applications; stimulation and pumping services; primary and remedial cementing services; nitrogen services; filtration services, as well as frac tanks and pumping units; and pipeline and industrial services, such as water filling and hydro testing, nitrogen purging, and de-gassing and pressure testing, as well as cutting/welding and cooling down piping/vessels systems. This segment also provides production assurance chemicals; integrated production management projects; artificial lift services; and surface and subsurface safety systems, high-pressure packer systems, flow controls, service tools, expandable liner technology, vacuum insulated tubing technology for steam applications, and engineering capabilities with manufacturing capacity and testing facilities, as well as sources and treats water for oil and gas, municipal, and industrial use. The Drilling and Evaluation Services segment offers drilling and workover rigs; rigs and integrated services; fishing and remediation solutions; directional and turbines drilling; drilling fluid systems and related technologies; wireline logging; slickline services, descaling, wax and sand cleanout, plug setting, gas lift valve changeout, fishing and other complex well applications; and well testing services to measure solids, gas, and oil and water produced from well, as well as drilling tools and machine shop services. This segment also provides oilfield solutions for thru-tubing intervention; tubular running services; and a range of wellhead products, flow control equipment, and frac equipment. National Energy Services Reunited Corp. was incorporated in 2017 and is headquartered in Houston, Texas.
Source: TradingView
The charts and visual representations are sourced from TradingView through embedded widgets. For any issues with chart display, please visit the TradingView website
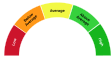
A unique technical analysis driven score developed by Kalkine showing momentum in stock prices based on select technical indicators identified.


| Breakdown | 2025-12-31 | 2024-12-31 | 2023-12-31 | 2022-12-31 | 2021-12-31 |
|---|---|---|---|---|---|
| Type | yearly | yearly | yearly | yearly | yearly |
| Date | 2025-12-31 | 2024-12-31 | 2023-12-31 | 2022-12-31 | 2021-12-31 |
| Income before tax | 60.40M | 95.50M | 29.85M | -29.80M | -60.58M |
| Minority interest | - | - | - | 0.00M | 0.00M |
| Net income | 51.13M | 76.31M | 12.58M | -36.42M | -64.57M |
| Selling general administrative | 47.64M | 52.20M | 49.17M | 47.53M | 28.07M |
| Gross profit | 145.96M | 208.67M | 129.88M | 65.48M | -15.26M |
| Reconciled depreciation | 141.73M | 142.78M | 142.23M | 115.84M | 122.12M |
| Ebit | 92.91M | 135.38M | 75.67M | - | -45.41M |
| Ebitda | 234.64M | 278.16M | 217.90M | - | 76.72M |
| Depreciation and amortization | 141.73M | 142.78M | 142.23M | - | 122.12M |
| Operating income | 98.32M | 137.70M | 80.70M | -0.92M | -43.33M |
| Other operating expenses | 1225.73M | 1164.00M | 1065.21M | - | 920.06M |
| Interest expense | 32.51M | 39.88M | 45.83M | 34.13M | 15.17M |
| Tax provision | 9.27M | 19.19M | 17.27M | 6.62M | 3.99M |
| Net interest income | -32.51M | -39.88M | -45.83M | -34.13M | -15.17M |
| Income tax expense | 9.27M | 19.19M | 17.27M | - | 3.99M |
| Total revenue | 1324.05M | 1301.70M | 1145.91M | 909.52M | 876.73M |
| Total operating expenses | 47.64M | 70.97M | 49.17M | 910.43M | 28.07M |
| Cost of revenue | 1178.09M | 1093.03M | 1016.04M | 844.04M | 891.99M |
| Total other income expense net | -37.92M | -42.21M | -50.86M | 5.24M | -17.25M |
| Net income from continuing ops | 51.13M | 76.31M | 12.58M | -36.42M | -64.57M |
| Breakdown | 2025-12-31 | 2024-12-31 | 2023-12-31 | 2022-12-31 | 2021-12-31 |
|---|---|---|---|---|---|
| Type | yearly | yearly | yearly | yearly | yearly |
| Date | 2025-12-31 | 2024-12-31 | 2023-12-31 | 2022-12-31 | 2021-12-31 |
| Total assets | 1851.52M | 1773.68M | 1797.74M | 1828.33M | 1831.29M |
| Intangible assets | 47.09M | 65.70M | 84.30M | 102.91M | 121.62M |
| Other current assets | 23.90M | 17.24M | 20.00M | 16.67M | 12.48M |
| Total liab | 883.60M | 865.45M | 976.25M | 1025.98M | 1010.26M |
| Total stockholder equity | 967.92M | 908.23M | 821.49M | 802.35M | 821.03M |
| Other current liab | 37.07M | 29.09M | 31.07M | 26.17M | 5.41M |
| Common stock | 902.85M | 894.29M | 883.87M | - | 856.79M |
| Capital stock | 902.85M | 894.29M | 883.87M | 877.30M | 856.79M |
| Retained earnings | 65.00M | 13.87M | -62.44M | -75.02M | -35.83M |
| Good will | 645.10M | 645.10M | 645.10M | 645.10M | 645.10M |
| Cash | 124.80M | 107.96M | 67.82M | 78.85M | 205.77M |
| Total current liabilities | 604.92M | 503.51M | 533.45M | 544.07M | 431.87M |
| Current deferred revenue | - | - | 14.87M | - | 12.41M |
| Net debt | 225.17M | 301.18M | 416.93M | 456.25M | 390.07M |
| Short term debt | 121.70M | 133.90M | 128.04M | - | 87.07M |
| Short long term debt | 118.75M | 128.46M | 120.63M | 143.24M | 87.07M |
| Short long term debt total | 349.97M | 409.13M | 484.75M | - | 595.84M |
| Total current assets | 630.37M | 540.52M | 541.72M | 537.81M | 627.37M |
| Net receivables | 386.84M | 318.55M | 355.46M | 148.71M | 315.25M |
| Long term debt | 191.38M | 254.39M | 331.56M | 391.86M | 508.76M |
| Inventory | 94.83M | 96.77M | 98.43M | 110.52M | 93.86M |
| Accounts payable | 421.06M | 305.31M | 351.24M | 353.54M | 314.57M |
| Accumulated other comprehensive income | 0.07M | 0.07M | 0.07M | - | 0.07M |
| Non currrent assets other | 43.21M | 58.18M | 52.33M | 51.47M | 11.71M |
| Non current assets total | 1221.14M | 1233.16M | 1256.03M | 1290.51M | 1203.92M |
| Capital lease obligations | 21.39M | 26.29M | 32.55M | 31.31M | 0.00M |
| Breakdown | 2025-12-31 | 2024-12-31 | 2023-12-31 | 2022-12-31 | 2021-12-31 |
|---|---|---|---|---|---|
| Type | yearly | yearly | yearly | yearly | yearly |
| Date | 2025-12-31 | 2024-12-31 | 2023-12-31 | 2022-12-31 | 2021-12-31 |
| Investments | 0.00M | -111.13M | -83.46M | -17.37M | -164.54M |
| Total cashflows from investing activities | -152.24M | -111.13M | -83.46M | - | -164.54M |
| Net borrowings | -78.26M | -74.12M | -88.76M | -58.35M | 190.93M |
| Total cash from financing activities | -87.26M | -78.06M | -104.53M | -72.80M | 167.54M |
| Net income | 51.13M | 76.31M | 12.58M | -36.42M | -64.57M |
| Change in cash | 16.84M | 40.13M | -11.03M | -126.92M | 130.76M |
| Begin period cash flow | 107.96M | 67.82M | 78.85M | 205.77M | 75.01M |
| End period cash flow | 124.80M | 107.96M | 67.82M | 78.85M | 205.77M |
| Total cash from operating activities | 264.24M | 229.33M | 176.96M | 92.58M | 127.74M |
| Depreciation | 141.73M | 142.78M | 142.23M | 115.84M | 122.12M |
| Other cashflows from investing activities | -13.69M | -6.03M | 0.76M | - | -5.54M |
| Change to inventory | 0.42M | -0.63M | 11.95M | -16.76M | -3.24M |
| Change to account receivables | -58.93M | 9.42M | -22.97M | -29.25M | -8.29M |
| Other cashflows from financing activities | -9.01M | -3.94M | -15.77M | - | -23.39M |
| Capital expenditures | 143.45M | 105.11M | 68.19M | 122.42M | 107.08M |
| Change in working capital | 48.25M | -9.16M | 7.71M | 1.23M | 62.78M |
| Stock based compensation | 8.32M | 6.03M | 6.76M | 9.27M | 9.76M |
| Other non cash items | 28.33M | 16.09M | 11.43M | 4.79M | 9.79M |
| Free cash flow | 120.79M | 124.22M | 108.77M | -29.84M | 20.67M |
Sector: Energy Industry: Oil & Gas Equipment & Services
|
Stock Name
|
Change
(USD) |
Price
(USD) |
Trailing
PE (x) |
Forward
PE (x) |
Price Sales
TTM (x) |
Price to Book Value (x)
|
Enterprise Value
to Revenue (x) |
Enterprise Value
to EBITDA (x) |
|---|---|---|---|---|---|---|---|---|
| NESR National Energy Services Reunited Corp Ordinary Shares |
0.04 0.18% |
19.59 | 35.66 | - | 2.00 | 3.17 | 2.12 | 11.98 |
| SLB SLB N.V. |
-0.64 1.27% |
49.74 | 26.44 | 16.31 | 2.21 | 3.04 | 2.42 | 13.18 |
| BKR Baker Hughes Co |
-0.18 0.37% |
48.04 | 18.24 | 17.57 | 2.03 | 2.83 | 2.05 | 11.20 |
| HAL Halliburton Company |
-0.17 0.52% |
31.71 | 18.29 | 12.12 | 1.33 | 2.65 | 1.58 | 9.83 |
| FTI TechnipFMC PLC |
0.51 0.80% |
64.49 | 25.50 | 21.74 | 2.82 | 8.73 | 2.77 | 14.51 |
National Energy Services Reunited Corp. provides oilfield services in the Middle East and North Africa. The company's Production Services segment offers hydraulic fracturing services; coiled tubing services, including nitrogen lifting, fishing, milling, clean-out, scale removal, and other well applications; stimulation and pumping services; primary and remedial cementing services; nitrogen services; filtration services, as well as frac tanks and pumping units; and pipeline and industrial services, such as water filling and hydro testing, nitrogen purging, and de-gassing and pressure testing, as well as cutting/welding and cooling down piping/vessels systems. This segment also provides production assurance chemicals; integrated production management projects; artificial lift services; and surface and subsurface safety systems, high-pressure packer systems, flow controls, service tools, expandable liner technology, vacuum insulated tubing technology for steam applications, and engineering capabilities with manufacturing capacity and testing facilities, as well as sources and treats water for oil and gas, municipal, and industrial use. The Drilling and Evaluation Services segment offers drilling and workover rigs; rigs and integrated services; fishing and remediation solutions; directional and turbines drilling; drilling fluid systems and related technologies; wireline logging; slickline services, descaling, wax and sand cleanout, plug setting, gas lift valve changeout, fishing and other complex well applications; and well testing services to measure solids, gas, and oil and water produced from well, as well as drilling tools and machine shop services. This segment also provides oilfield solutions for thru-tubing intervention; tubular running services; and a range of wellhead products, flow control equipment, and frac equipment. National Energy Services Reunited Corp. was incorporated in 2017 and is headquartered in Houston, Texas.
| Name | Title | Year Born |
|---|---|---|
| Mr. Thomas D. Wood | Independent Director | 1957 |
| Mr. Sherif Foda | Exec. Chairman & CEO | 1969 |
| Mr. Stefan Angeli | Chief Financial Officer | NA |
| Mr. Salih Merghani | VP of Operations | NA |
| Mr. Blake Geelhoed Gendron | VP of Investor Relations & Bus. Devel. | NA |
| Ms. Cathy Konwisarz | Gen. Counsel & Corp. Sec. | NA |
| Mr. Dhiraj Dudeja | Chief Commercial Officer | 1977 |
| Ms. Sahar Badran | Head of Legal | NA |
| Ms. Haya Kablawi | Corp. Financial Controller | NA |
| Hani Almaimani | VP of Arabian Region | NA |
Disclaimer - (*)This information, including any data, is sourced from Unicorn Data Services SAS, trading as EOD Historical Data (“EODHD”) on an ‘as is’ basis, using their API. We cannot guarantee the completeness or validity of the information and data provided on this page, as well as via the API. In some cases, the data may include analyst ratings or recommendations sourced through the EODHD API, which are intended solely for general information purposes.
This information does not consider your personal objectives, financial situation, or needs. Kalkine is not liable for any errors or omissions in the information provided or for any actions taken in reliance on it. You should seek advice from a financial adviser, stockbroker or other professional adviser (including taxation and legal advice) as necessary before acting on this information.

Download a free report with stock ideas and industry insights for general information.
Download Free Report Now →


Basic Materials
 -1.07%
Communication Services
-0.42%

Consumer Cyclical
-0.41%

Consumer Defensive
-0.22%

Energy
-0.09%

Financial Services
-0.14%
Financials
-0.48%

Healthcare
-0.22%

Industrials
-0.11%

Real Estate
-0.53%

Technology
-0.23%

Utilities
-0.54%
Note: Daily price change (%) by sector excluding stocks with +/-90% daily price change. Companies above $500 million market capitalization are considered.
 Portfolio
 Watchlist


 +1.15%
 Please wait processing your request...