
 CA
 NZ
 UK
 AU
 IND

 US

 Share
 X (Formerly Twitter)
 Whatsapp
 Facebook
 LinkedIn
 Telegram
 Email This Article
 Copy Link
 Summarize with AI
 Chat GPT
 Perplexity

HF Sinclair Corporation (NYSE: DINO) is experiencing an orderly intraday consolidation directly beneath its newly established 52-week peak after an aggressive multi-week breakout. As of this chart snapshot (intraday trading on October 14, 2026), shares trade at $127.90, down $0.33 (-0.26%). The stock opened at $128.51, pushed to an intraday high of $129.37, and defended a session low of $126.56. This modest pause follows a steep, uninterrupted advance from the late-September dynamic test near $104.00, carrying the price into new high territory alongside the broader rally in refining equities. With crude prices holding firm above $100/bbl, the chart setup reflects strong institutional accumulation paired with near-term overbought digestion. 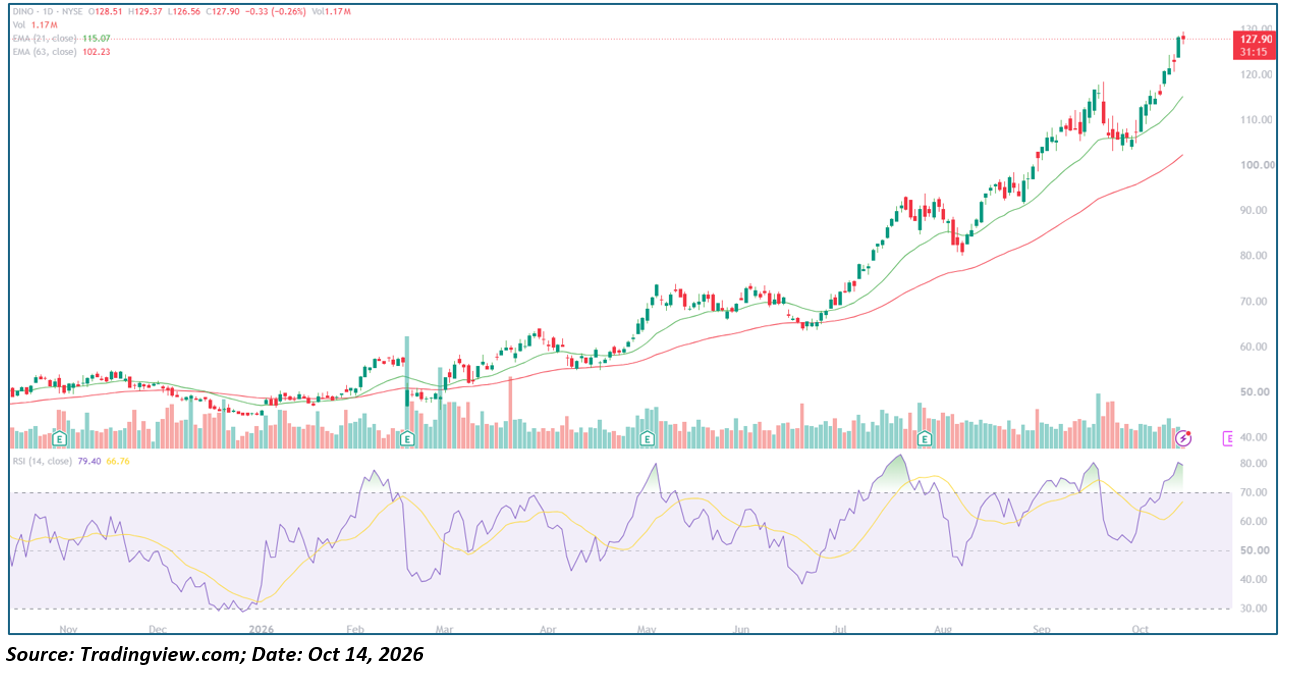
Key Highlights
- Trading at $127.90, down $0.33 (-0.26%), on partial-session Volume of 1.17M shares.
- Opened at $128.51, touching an intraday high of $129.37 and holding above a low of $126.56.
- 21-day EMA at $115.07 and 63-day EMA at $102.23, both sloping steeply upward in a strong bullish trend alignment.
- 14-day RSI at 79.40, running well above its 66.76 signal line and entering an extended overbought zone (>70).
- Resistance at $129.37 (intraday high), ~$132.00 (Fibonacci extension), and ~$135.00; support at $126.56 (session low), ~$118.00–$120.00 (prior breakout shelf), and $115.07 (21-day EMA).
Trend Structure: Three-Act Pattern
- Base Accumulation and Spring Breakout (November 2025 – April 2026):
DINO spent late 2025 building an accumulation base in the $45.00–$55.00 range, establishing a firm bottom in December. A volume-backed recovery in early 2026 lifted shares through both EMAs, driving an impulse into May that reached an initial peak near $74.00 before entering a multi-week consolidation.
- Mid-Year Consolidation and Secondary Impulse (June – August 2026):
After pulling back to test its rising 63-day EMA near $64.00 in late June, institutional Demand accelerated. A sharp breakout in July drove shares through $80.00 and up to $95.00 by early August, pushing the RSI into overbought territory before the stock consolidated gains with a test of $80.00 support.
- Parabolic Expansion to New Highs (September – October 2026):
Following a brief corrective test of dynamic EMA support near $104.00 in late September, DINO launched a vertical advance. The stock gained more than 20% over two weeks, printing a high of $129.37 in October and trading up over 150% from its late-2025 baseline.
Backdrop
The chart marks previous quarterly Earnings reports ("E") in November 2025, February, May, and August 2026. The next scheduled earnings marker sits at the far right edge of the chart (due late October / early November). Past earnings events for DINO have prompted strong directional trend continuations, making upcoming guidance on refining throughput, crack spreads, and Capital returns pivotal for intermediate momentum.
Moving Averages and Momentum Profile
- Moving Average Stack: The 21-day EMA ($115.07) is expanding rapidly above the 63-day EMA ($102.23). Shares trade roughly 11.1% above the 21-day EMA and 25.1% above the 63-day EMA, confirming strong momentum while increasing mean-reversion risk on broader market pullbacks.
- Oscillator Behavior: The 14-day RSI sits at 79.40, well above its 66.76 signal line. An RSI reading near 80 reflects dominant buyer control, though it warns of near-term consolidation or shallow pullbacks as gains are digested.
- Volume Behavior: Session volume stands at 1.17M shares on an incomplete session, matching average daily turnover. A sustained push through the $130.00–$132.00 zone will require expanding volume toward 2.0M+ shares to validate institutional follow-through.
Key Technical Levels
|
Level |
Type |
Note |
|---|---|---|
|
~$135.00 |
Resistance |
Upper channel projection target |
|
~$132.00 |
Resistance |
1.618 Fibonacci expansion level |
|
$129.37 |
Resistance |
Current 52-week intraday high |
|
$127.90 |
Reference |
Current market price |
|
$126.56 |
Support |
Session intraday low |
|
~$118.00–$120.00 |
Support |
Prior consolidation swing shelf |
|
$115.07 |
Support |
Dynamic 21-day EMA |
|
$102.23 |
Support |
Dynamic 63-day EMA |
|
~$104.00 |
Support |
Late-September swing low |
Actionable Technical Outlook
- A sustained daily close above $129.37 confirms continuation into open territory, opening an immediate path toward $132.00, with secondary extensions toward $135.00.
- The primary bullish structure remains healthy as long as pullbacks hold above the $118.00–$120.00 prior shelf and the ascending 21-day EMA ($115.07).
- With the RSI stretched at 79.40, short-term sideways consolidation above $126.56 would allow dynamic averages to catch up before another leg higher.
Metadata
|
Field |
Value |
|---|---|
|
Headline |
Why is HF Sinclair (NYSE: DINO) Pulling Back to $127.90 After Fresh Highs, and Can It Clear $132? |
|
SEO title |
HF Sinclair (DINO) Stock Analysis: Overbought RSI 79, EMA Support, and $132 Target |
|
Meta description |
HF Sinclair (NYSE: DINO) consolidates at $127.90 after setting new 52-week highs. Technical Analysis covering the 21-day EMA stack, overbought RSI, and key price levels. |
|
Slug |
why-hf-sinclair-dino-stock-pullback-52-week-high-rsi-overbought-132-level |
|
Tags |
HF Sinclair, DINO, NYSE, energy sector, refining, technical analysis, moving averages, RSI, 52-week high |
|
Ticker / Sector |
DINO / Energy |
|
Verification status |
PARTIAL (levels extracted directly from TradingView chart snapshot; Q3 earnings release date requires company verification) |
|
Data as-of date |
October 14, 2026 (intraday trading session) |


 Oct 31, 2026





 Please wait processing your request...