
 CA
 NZ
 UK
 AU
 IND

 US

 Share
 X (Formerly Twitter)
 Whatsapp
 Facebook
 LinkedIn
 Telegram
 Email This Article
 Copy Link
 Summarize with AI
 Chat GPT
 Perplexity

Marathon Petroleum Corp. (NYSE: MPC) is accelerating into uncharted territory, printing fresh all-time highs following an extended multi-month parabolic impulse. As of this chart snapshot (intraday trading on October 14, 2026), shares trade at $481.21, up $4.23 (+0.89%). The stock opened at $480.00, reached a new record intraday peak of $482.01, and defended a session trough of $473.56. The move extends a powerful advance off the late-September dynamic support test near $380.00, lifting shares out of an orderly multi-week consolidation base. With refining margins and energy equities buoyed by elevated global crude pricing, the setup reflects persistent institutional accumulation and trend expansion. 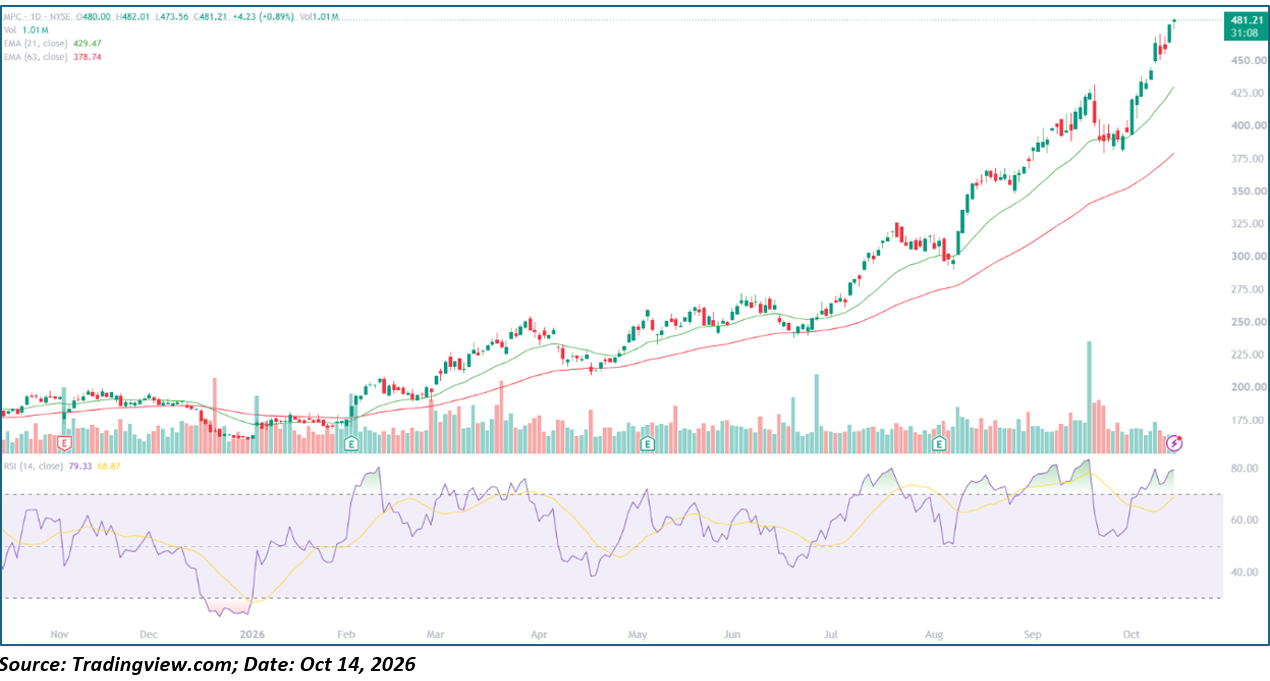
Key Highlights
- Trading at $481.21, up $4.23 (+0.89%), on partial-session Volume of 1.01M shares.
- Opened at $480.00, reaching a fresh record peak of $482.01 and an intraday low of $473.56.
- 21-day EMA at $429.47 and 63-day EMA at $378.74, both sloping steeply upward beneath price in a clean golden-cross configuration.
- 14-day RSI at 79.33, positioned well above its 68.87 signal line and pressing deep into overbought territory (>70).
- Resistance at $482.01 (record high), ~$490.00 (Fibonacci extension), and ~$500.00 (major psychological barrier); support at $473.56 (session low), ~$440.00–$445.00 (prior breakout peak), and $429.47 (dynamic 21-day EMA).
Trend Structure: Three-Act Pattern
- Base Building and Early Spring Breakout (November 2025 – April 2026):
MPC consolidated throughout late 2025 in a tight $170.00–$200.00 range, bottoming near $165.00 in December. A heavy-volume post-earnings thrust in February initiated a sustained uptrend along the rising 21-day EMA, driving shares to a spring peak near $250.00 before entering a multi-week consolidation channel through May.
- Mid-Year Accumulation and Trend Acceleration (June – August 2026):
After establishing a solid higher cycle low near $230.00 in June, institutional buying accelerated dramatically. Consecutive momentum thrusts carried the stock through $300.00 in July and pushed it to an interim peak near $330.00 in early August, with the 14-day RSI repeatedly tapping the 80 zone.
- Parabolic Expansion and Breakout to All-Time Highs (September – October 2026):
A brief pullback into the 63-day EMA near $380.00 in late September met aggressive dip-buying demand. MPC subsequently launched a vertical continuation leg in October, advancing from $385.00 to print a fresh record peak of $482.01—gaining over 180% from its late-2025 base.
Backdrop
The chart displays previous quarterly Earnings markers ("E") in November 2025, February, May, and August 2026. The upcoming earnings marker sits at the far-right edge of the chart (scheduled for late October / early November), making Q3 crack spreads, refining throughput, and dividend/buyback commentary the primary forward catalysts. Single-session moves around earnings historically generated strong follow-through for MPC, warranting careful position sizing as the event window approaches.
Moving Averages and Momentum Profile
- Moving Average Stack: The 21-day EMA ($429.47) is diverging steeply above the 63-day EMA ($378.74). Price trades roughly 12.0% above the 21-day EMA and 27.0% above the 63-day EMA, reflecting an extended momentum impulse that carries mean-reversion risk in the event of broad market de-risking.
- Oscillator Behavior: The 14-day RSI sits at 79.33, tracking well above its 68.87 signal line. While an RSI near 80 highlights strong buying conviction, it enters an extreme overbought regime where consolidation or upper-wick rejection is common.
- Volume Behavior: Turnout stands at 1.01M shares on an incomplete session. Pushing through the psychological $500 milestone will require volume expansion toward the 2.0M+ spikes observed during the late-July and mid-September impulse phases.
Key Technical Levels
|
Level |
Type |
Note |
|---|---|---|
|
~$500.00 |
Resistance |
Major psychological milestone and macro channel ceiling |
|
~$490.00 |
Resistance |
1.618 Fibonacci expansion zone |
|
$482.01 |
Resistance |
All-time intraday record high and immediate hurdle |
|
$481.21 |
Reference |
Current market price |
|
$473.56 |
Support |
Current session low and immediate intraday floor |
|
~$440.00–$445.00 |
Support |
Mid-September swing peak and prior breakout shelf |
|
$429.47 |
Support |
Dynamic 21-day EMA |
|
$378.74 |
Support |
Dynamic 63-day EMA |
|
~$380.00 |
Support |
Late-September swing low Demand base |
Actionable Technical Outlook
- A sustained daily close above $482.01 confirms blue-sky continuation, clearing the runway toward $490.00 and the major psychological milestone at $500.00.
- The intermediate parabolic trend structure remains fully protected as long as price holds above the prior swing high near $440.00 and the rising 21-day EMA ($429.47).
- With the 14-day RSI stretched at 79.33, a short-term pause or shallow test of the $473.56 session low would serve to digest overbought conditions before the next expansion attempt.
Metadata
|
Field |
Value |
|---|---|
|
Headline |
Why is Marathon Petroleum (NYSE: MPC) Surging to $481.21 at Fresh Record Highs, and Can It Clear $500? |
|
SEO title |
Marathon Petroleum (MPC) Stock Hits Record High: RSI 79, EMA Support, and $500 Target |
|
Meta description |
Marathon Petroleum (NYSE: MPC) surges to $481.21 at all-time highs. Technical Analysis covering the 21-day EMA stack, overbought RSI, and $500 resistance. |
|
Slug |
why-marathon-petroleum-mpc-stock-all-time-high-rsi-overbought-500-level |
|
Tags |
Marathon Petroleum, MPC, NYSE, energy sector, oil refining, technical analysis, moving averages, RSI, all-time high |
|
Ticker / Sector |
MPC / Energy |
|
Verification status |
PARTIAL (levels extracted directly from TradingView chart snapshot; upcoming Q3 earnings release date requires company confirmation) |


 Oct 31, 2026





 Please wait processing your request...