
 CA
 NZ
 UK
 AU
 IND

 US

 Share
 X (Formerly Twitter)
 Whatsapp
 Facebook
 LinkedIn
 Telegram
 Email This Article
 Copy Link
 Summarize with AI
 Chat GPT
 Perplexity

Obsidian Energy Ltd. (AMEX: OBE) is undergoing an intraday pullback after staging a multi-day technical rebound that lifted shares back above both their 21-day and 63-day exponential moving averages. As of this chart snapshot (intraday trading on October 14, 2026), shares are trading at $11.54, down $0.23 (-1.95%). The stock opened at $11.85, touched an intraday session high of $11.91, and tested an intraday low of $11.52. The modest pause follows a sharp relief bounce off early-October lows near $10.00, bringing price into contact with overhead resistance from the late-September distribution range. In the absence of an immediate company-specific filing on the tape, the setup is driven by technical moving-average dynamics and resistance absorption. 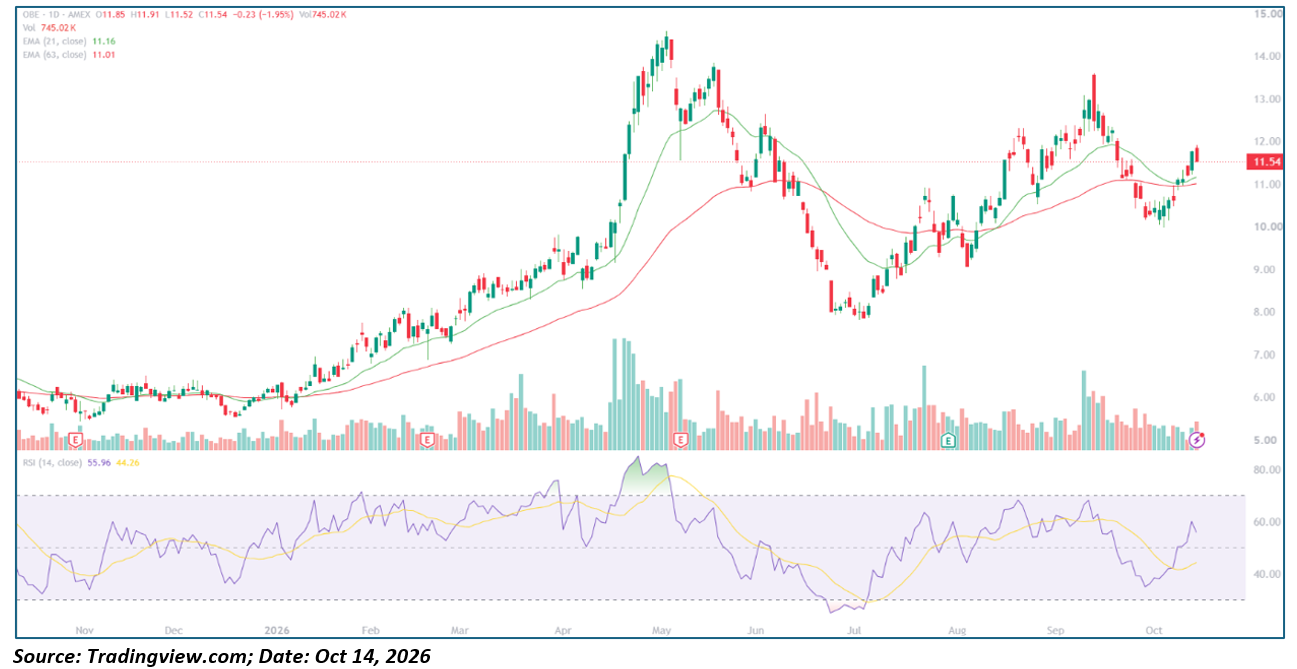
Key Highlights
- Trading at $11.54, down $0.23 (-1.95%), on partial-session Volume of 745.02K shares.
- Opened at $11.85, reaching an intraday high of $11.91 and defending a low of $11.52.
- 21-day EMA at $11.16 and 63-day EMA at $11.01, both tracking beneath price in a supportive golden-cross posture.
- 14-day RSI at 55.96, positioned above its 44.26 signal line and holding constructive territory above the neutral 50 threshold.
- Resistance at $11.91–$12.00 (session high / round number), ~$12.50, and ~$13.50 (September cycle peak); support at $11.52 (session low), $11.16 (21-day EMA), and $11.01 (63-day EMA).
Trend Structure: Three-Act Pattern
- Multi-Month Accumulation and Parabolic Spike (November 2025 – May 2026):
OBE broke out from a base near $5.50–$6.00 in late 2025, grinding higher along its rising 21-day EMA through early 2026. In April and May, volume surged to drive a parabolic impulse to an annual peak near $14.60, pushing the 14-day RSI above 80 into extreme overbought territory.
- Corrective Distribution and Summer Bottom (June – July 2026):
A heavy wave of selling followed the May peak, slicing through both key moving averages and sending the stock into a rapid downtrend that carved out a multi-month Capitulation low near $7.80 in July. The 14-day RSI dropped below 30 into deeply oversold conditions, resetting the macro momentum structure.
- Multi-Leg Recovery and Autumn Consolidation (August – October 2026):
From the July trough, buyers returned aggressively to reclaim both moving averages, driving a strong swing that topped out near $13.50 in September. A sharp corrective dip in late September/early October tested Demand near $10.00, but consecutive accumulation candles quickly lifted price back above the 21-day and 63-day EMAs, establishing a higher low above the summer base.
Backdrop
The chart displays Earnings markers ("E") in late October/early November 2025, late February, May, and August 2026. The next earnings ICON sits at the far-right edge of the chart, signaling that the Q3 2026 financial report is imminent. Given that prior quarterly announcements have triggered sharp trend inflections and expanded volatility, positional risk management around upcoming event dates remains essential.
Moving Averages and Momentum Profile
- Moving Average Stack: The 21-day EMA ($11.16) has maintained its position above the 63-day EMA ($11.01), providing a tight dynamic support band roughly 4% beneath current market prices. Price holding above both moving averages keeps short-term trend control with buyers.
- Oscillator Behavior: The 14-day RSI prints at 55.96, holding comfortably above its 44.26 signal line after curling out of the low-40s. This demonstrates healthy momentum expansion with substantial headroom before reaching overbought saturation (>70).
- Volume Behavior: Turnout stands at 745.02K shares during an incomplete session. While adequate for an orderly pullback, a decisive breakout over $12.00–$12.50 will require volume expansion toward 1.5M+ shares to confirm institutional follow-through.
Key Technical Levels
|
Level |
Type |
Note |
|---|---|---|
|
~$14.60 |
Resistance |
May 2026 macro cycle high |
|
~$13.50 |
Resistance |
September 2026 recovery peak |
|
~$12.50 |
Resistance |
Breakdown origin and upper consolidation shelf |
|
$11.91 |
Resistance |
Session intraday high and immediate overhead ceiling |
|
$11.54 |
Reference |
Current market price |
|
$11.52 |
Support |
Session intraday low |
|
$11.16 |
Support |
Dynamic 21-day EMA |
|
$11.01 |
Support |
Dynamic 63-day EMA |
|
~$10.00 |
Support |
Early-October swing low and structural demand floor |
Actionable Technical Outlook
- A sustained daily close above $11.91–$12.00 would confirm upside continuation, clearing a pathway toward the primary intermediate resistance target at $12.50, followed by the September peak near $13.50.
- The near-term rebound remains technically valid as long as price defends the dynamic EMA confluence between $11.01 and $11.16 on closing prints.
- A break back below the $11.00 moving-average cluster would neutralize the current recovery, risking an extended retest of the early-October support base near $10.00.
Metadata
|
Field |
Value |
|---|---|
|
Headline |
Why is Obsidian Energy (AMEX: OBE) Pulling Back to $11.54 After an EMA Reclaim, and Can It Clear $12.50? |
|
SEO title |
Obsidian Energy (OBE) Stock Analysis: EMA Confluence, RSI 56, and $12.50 Target |
|
Meta description |
Obsidian Energy (AMEX: OBE) slips 1.95% to $11.54 after reclaiming key moving averages. Technical Analysis of EMA support, RSI momentum, and key resistance targets. |
|
Slug |
why-obsidian-energy-obe-stock-pullback-ema-support-12-50-level |
|
Tags |
Obsidian Energy, OBE, AMEX, energy sector, oil and gas, technical analysis, moving averages, RSI, earnings |
|
Ticker / Sector |
OBE / Energy (E&P) |
|
Verification status |
PARTIAL (levels read directly from TradingView chart snapshot; official earnings release date requires company confirmation) |
|
Data as-of date |
October 14, 2026 (intraday trading session) |


 Oct 31, 2026





 Please wait processing your request...