
 CA
 NZ
 UK
 AU
 IND

 US

 Share
 X (Formerly Twitter)
 Whatsapp
 Facebook
 LinkedIn
 Telegram
 Email This Article
 Copy Link
 Summarize with AI
 Chat GPT
 Perplexity

Key Highlights
Energy (XLE) and Utilities (XLU) remained in Leading, with positive relative strength and positive momentum; both are positioned high in the upper-right quadrant.
Consumer Staples (XLP), Consumer Discretionary (XLY) and Healthcare (XLV) are also in Leading, although XLV sits close to the horizontal midpoint.
Financials (XLF), Real Estate (XLRE), Materials (XLB) and Industrials (XLI) occupy Improving, showing positive momentum but negative relative strength.
Technology (XLK) is in Weakening, with positive relative strength but deeply negative momentum.
Communication Services (XLC) remains in Lagging, with negative momentum and negative relative strength.
The chart shows five sectors in Leading, four in Improving, one in Weakening and one in Lagging, indicating a wider Leading group but persistent weakness in selected sectors.
The US sector momentum structure on 19 October 2026 shows Energy and Utilities firmly in Leading, joined by Consumer Staples, Consumer Discretionary and Healthcare. Financials, Real Estate, Materials and Industrials remain in Improving, with positive momentum but relative strength still below the chart’s vertical midpoint. Technology sits in Weakening, while Communication Services remains in Lagging. Compared with a chart dominated by Improving sectors, the current configuration shows more sectors in the Leading quadrant, but momentum is uneven and the separation of XLK and XLC from the main group remains notable.
US Sector Momentum Quadrants
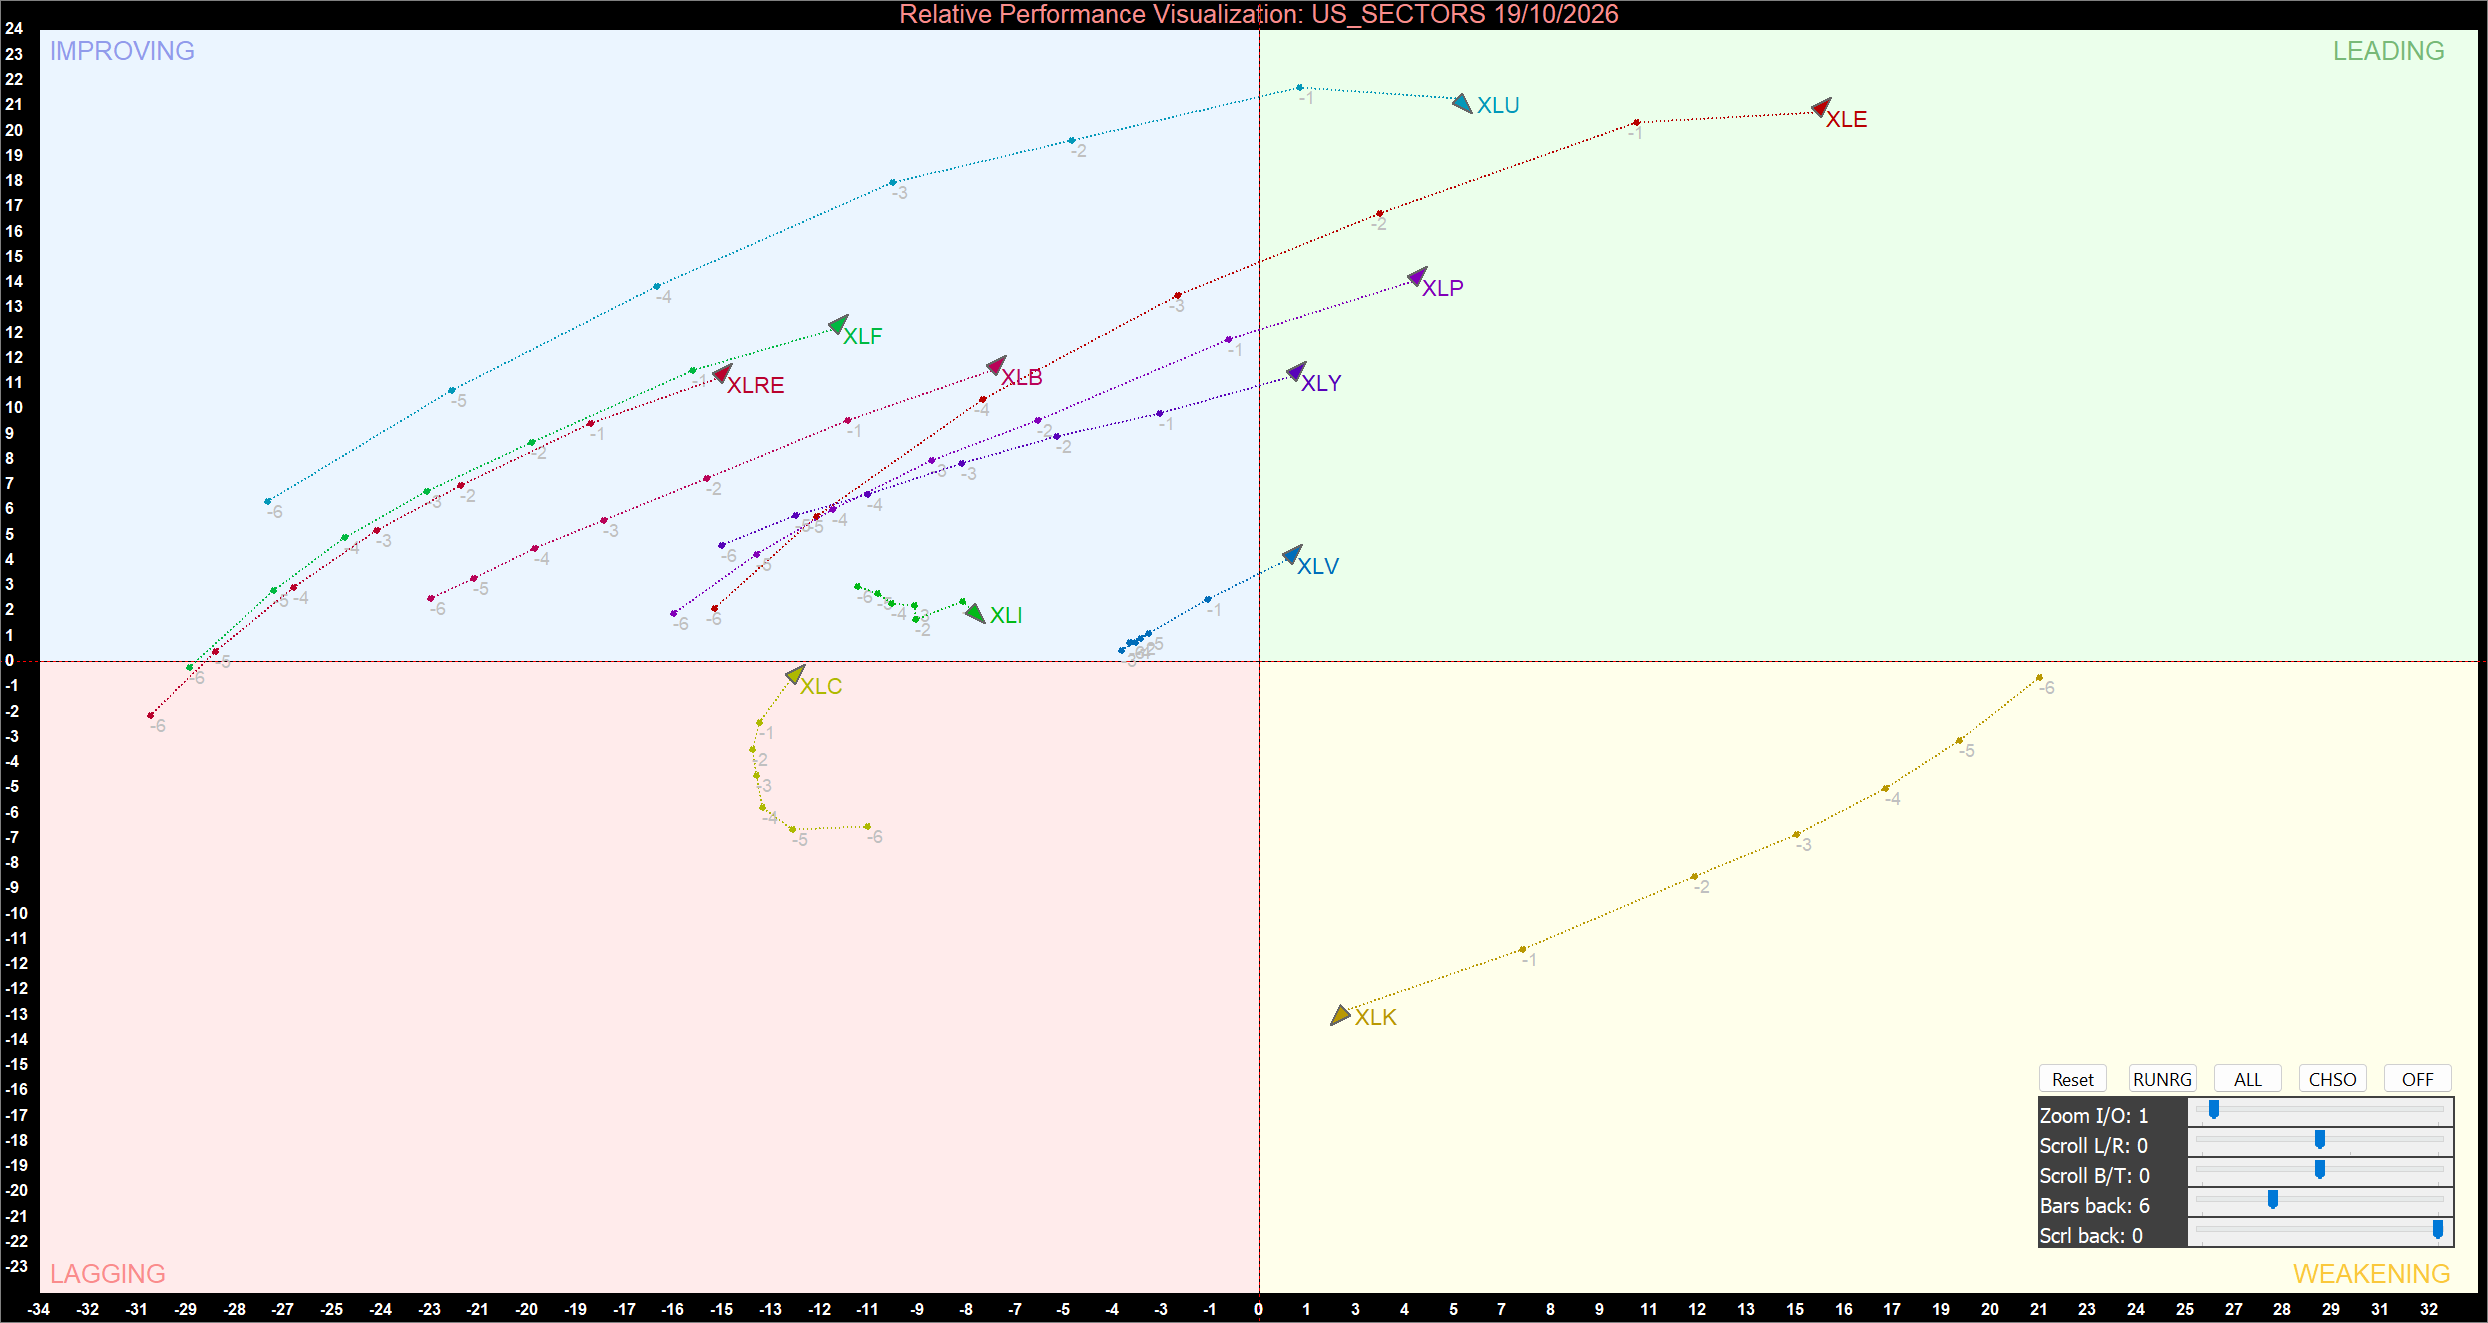
US Sector Relative Momentum Chart at the closing price of 19/10/2026. Powered by: amibroker.com.
Momentum Quadrants
Leading Group Expands
Energy (XLE) remains clearly in Leading, with its endpoint high above the horizontal midpoint and to the right of the vertical axis. This configuration indicates positive relative strength and positive momentum. Its plotted trajectory continues toward the upper-right area, making Energy one of the chart’s clearest leaders. The key momentum signal is whether the endpoint can maintain its elevated position or begins to flatten, which would indicate that its rate of improvement is slowing.
Utilities (XLU) also occupies Leading, with a high positive momentum reading and positive relative strength. Its endpoint is positioned well above the horizontal boundary and to the right of the vertical axis. Although its trajectory has eased slightly from a previous high, the sector remains in a strong quadrant. Continued positioning in the upper-right would reinforce its momentum status; a sustained move back below the horizontal axis would signal a more material deterioration.
Consumer Staples (XLP) and Consumer Discretionary (XLY) are also in Leading. Both remain above the horizontal midpoint and to the right of the vertical axis, indicating positive momentum alongside positive relative strength. Healthcare (XLV) has entered the same quadrant, but its endpoint is much closer to the horizontal boundary. That proximity makes its momentum reading more modest and leaves it more exposed to a move back into Improving if momentum fades. The Leading group has therefore broadened, although the sectors do not all display the same degree of momentum.
Improving Sectors Retain Positive Momentum
Financials (XLF), Real Estate (XLRE), Materials (XLB) and Industrials (XLI) remain in Improving. Their endpoints are above the horizontal midpoint but left of the vertical axis, indicating positive momentum while relative strength remains negative against the comparison group. This is a constructive configuration, but it does not yet confirm that these sectors have established relative leadership.
Financials and Real Estate sit at comparatively elevated positive momentum readings within Improving, while Materials is also positioned above the horizontal boundary. Industrials is closer to the centre and has a more modest positive momentum reading. For these sectors, the key signal would be a sustained move across the vertical axis into Leading. Until that transition occurs and persists, the chart supports a momentum-recovery interpretation rather than a conclusion that Leadership has been established.
Technology Weakens While Communication Services Lags
Technology (XLK) remains in Weakening, to the right of the vertical axis but well below the horizontal midpoint. Relative strength is still positive, but momentum is strongly negative and the endpoint is separated from the main cluster of sectors. A move above the horizontal midpoint would be the first chart signal of momentum recovery and could move XLK toward Leading, provided it remains to the right of the vertical axis. Continued movement in Weakening would indicate that momentum deterioration persists.
Communication Services (XLC) occupies Lagging, with its endpoint below the horizontal midpoint and left of the vertical axis. This indicates both negative momentum and negative relative strength. Its trajectory remains separate from the Improving and Leading groups and does not yet show a sustained recovery toward the centre. An upward move toward and above the horizontal midpoint would provide an initial momentum-recovery signal; a later move across the vertical axis would be needed to indicate positive relative strength.
Bottom Line
The 19 October 2026 US sector momentum chart places five sectors in Leading, four in Improving, Technology in Weakening and Communication Services in Lagging. Energy and Utilities remain the clearest momentum leaders, while Consumer Staples, Consumer Discretionary and Healthcare have joined the upper-right quadrant. The key follow-up signals are whether the Leading sectors sustain positive momentum, whether Improving sectors cross into positive relative strength, whether XLK recovers above the horizontal midpoint, and whether XLC turns upward. These quadrant readings describe the current relative-momentum configuration and should be reassessed as subsequent chart points develop.


 Oct 29, 2026




 Please wait processing your request...