
 CA
 NZ
 UK
 AU
 IND

 US

 Share
 X (Formerly Twitter)
 Whatsapp
 Facebook
 LinkedIn
 Telegram
 Email This Article
 Copy Link
 Summarize with AI
 Chat GPT
 Perplexity

Key Highlights
- Nine sectors were positioned in Improving, indicating positive momentum readings while relative strength remained below the chart’s vertical midpoint.
- Energy (XLE) led daily performance, gaining 1.80%, and occupied Improving with a strong upward trajectory.
- Utilities (XLU), Materials (XLB), Financials (XLF), Real Estate (XLRE), Consumer Staples (XLP), Industrials (XLI), Health Care (XLV) and Consumer Discretionary (XLY) were also positioned in Improving.
- Information Technology (XLK) was the only sector in Weakening, with positive relative strength but negative momentum.
- Communication Services (XLC) remained in Lagging despite gaining 0.74% during the session.
- No sector occupied Leading, making the next direction of the plotted trajectories important for confirming a broader improvement in relative strength.
The US sector momentum structure on 13 October 2026 remained concentrated in the Improving quadrant. The Relative Performance Visualization placed Energy, Utilities, Materials, Financials, Real Estate, Consumer Staples, Industrials, Health Care and Consumer Discretionary in Improving. Communication Services remained in Lagging, while Information Technology occupied Weakening. The chart therefore indicates that momentum readings were positive across most sectors, but none had moved into the Leading quadrant.
US Sector Momentum Quadrants
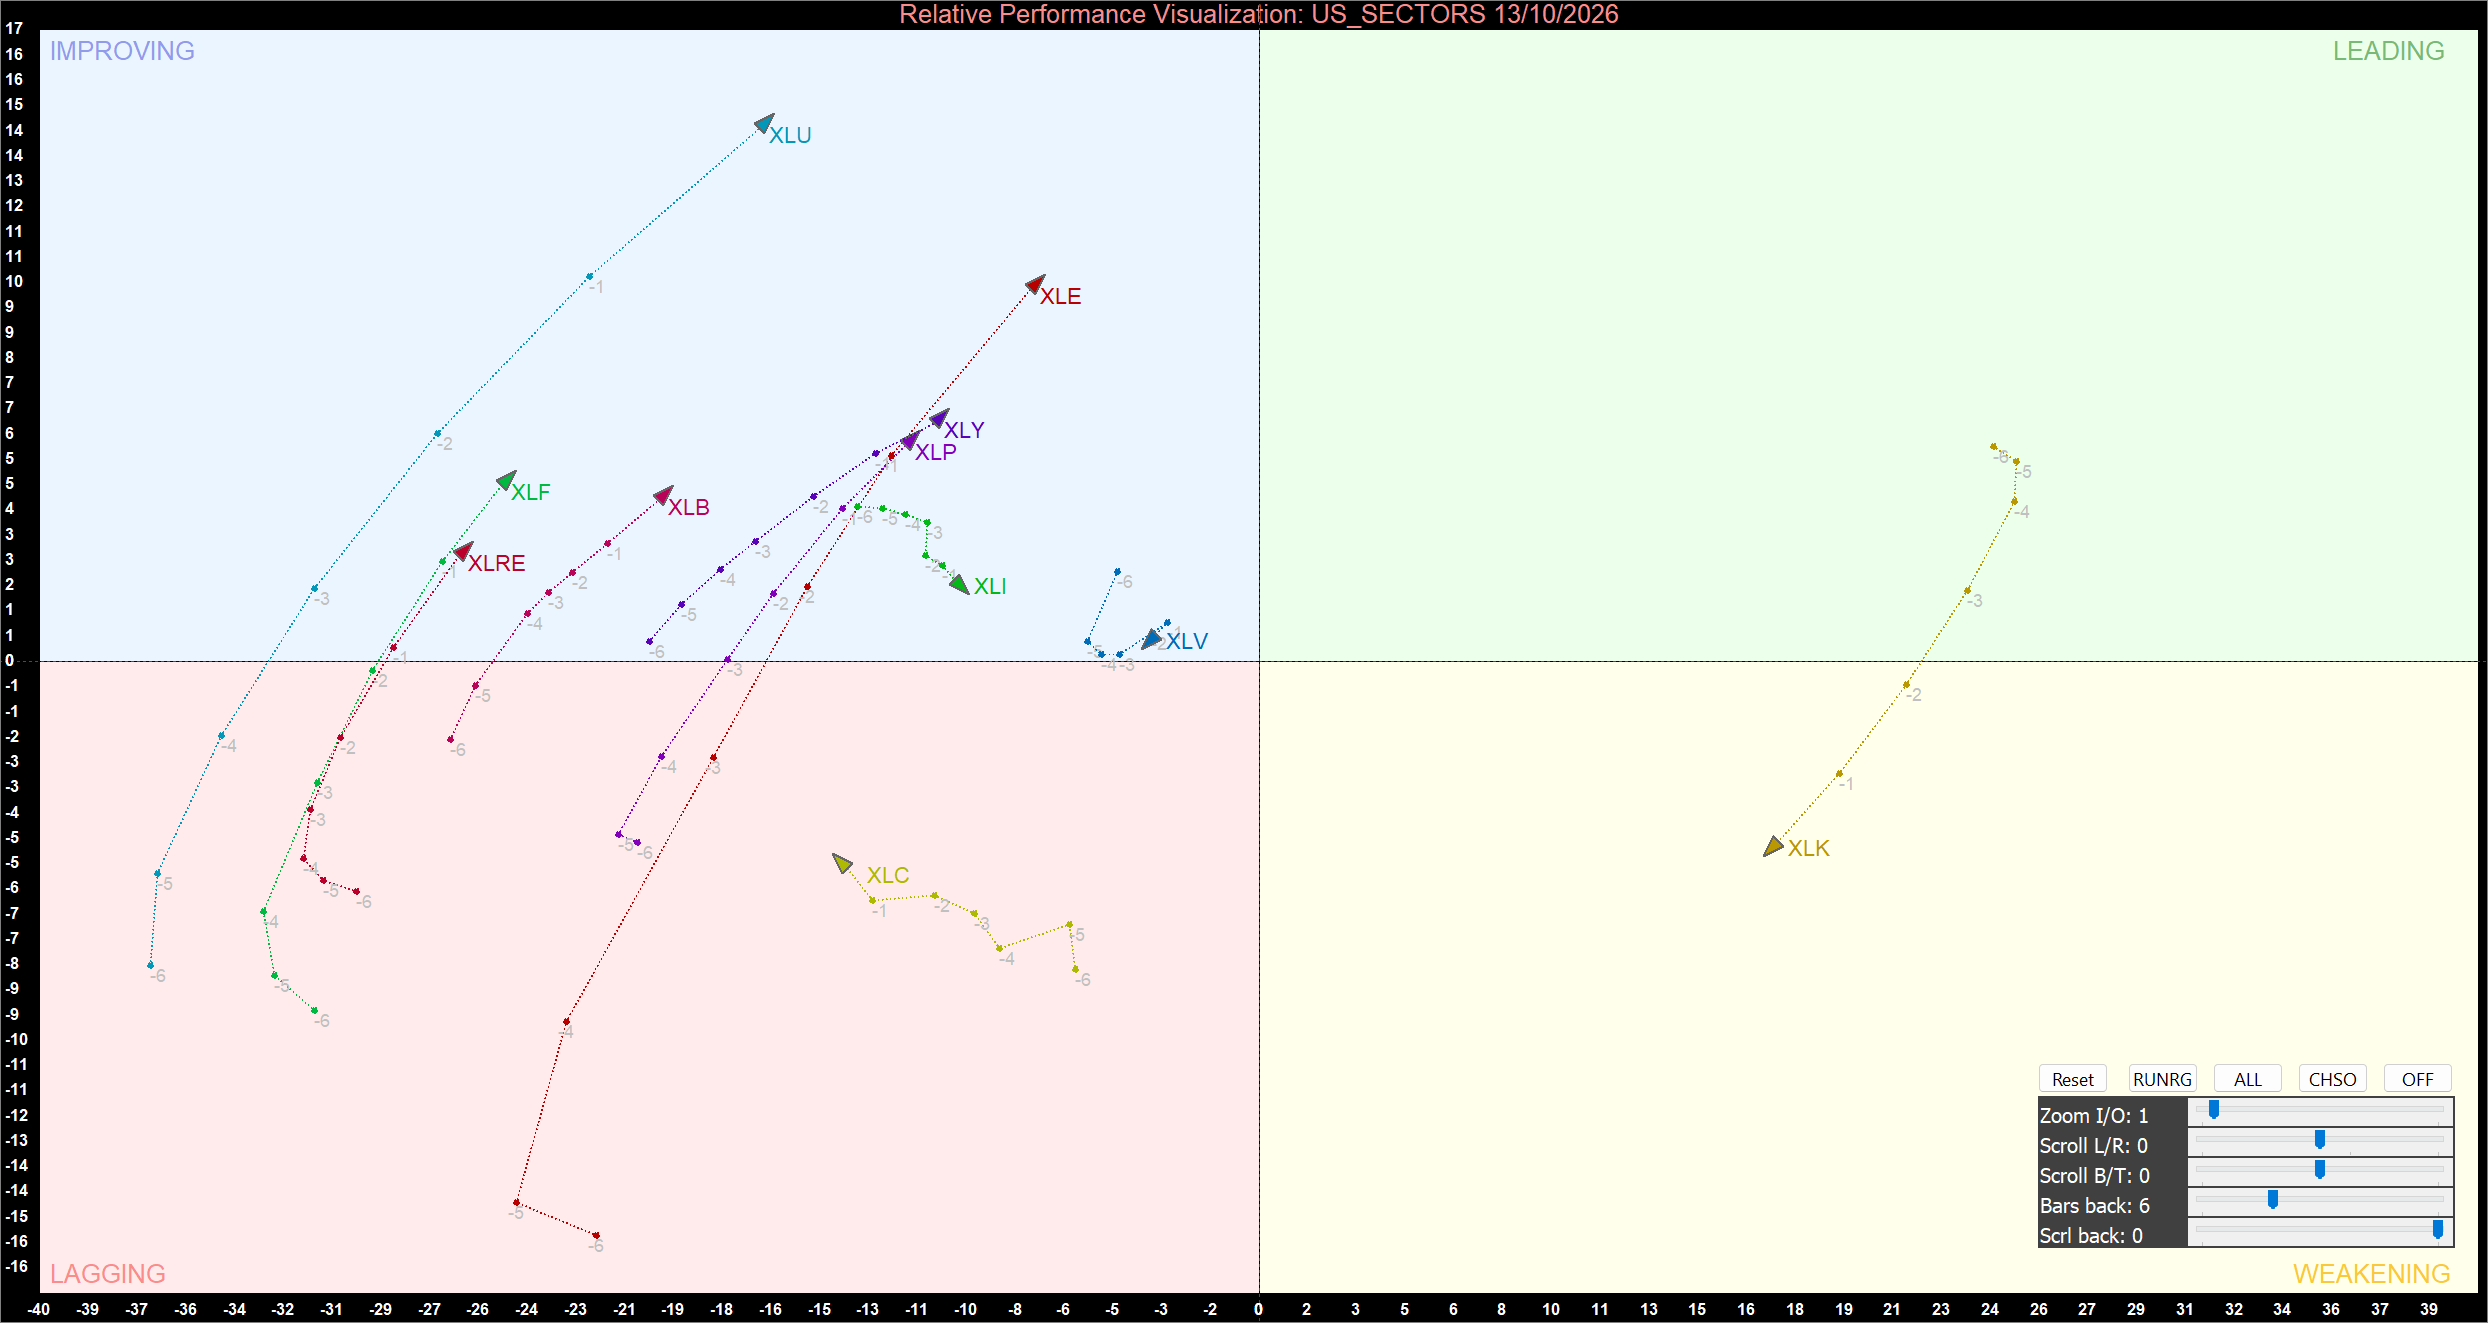
US Sector Relative Momentum Chart at the closing price of 13/10/2026. Powered by: amibroker.com.
Improving Quadrant
Energy (XLE), Utilities (XLU), Materials (XLB), Financials (XLF), Real Estate (XLRE), Consumer Staples (XLP), Industrials (XLI), Health Care (XLV) and Consumer Discretionary (XLY) were positioned in Improving. Their latest plotted endpoints sit above the horizontal midpoint but to the left of the vertical axis. This configuration indicates positive momentum readings, although relative strength remains negative against the comparison group.
Utilities stands out visually, with its endpoint substantially higher than those of most sectors, indicating a strong momentum reading within Improving. Energy also shows a clear upward trajectory, while Consumer Discretionary and Consumer Staples are clustered at positive momentum levels. Materials, Financials and Real Estate sit closer to the central horizontal boundary, suggesting less pronounced positive momentum. The Improving group is therefore broad but uneven, and subsequent direction will matter more than quadrant membership alone.
The daily returns provide context without determining quadrant placement. Energy gained 1.80%, Utilities rose 0.58% and Materials added 0.57%. Consumer Discretionary was almost unchanged at 0.08%, while Consumer Staples fell 0.26%, Industrials declined 0.28%, Financials lost 0.42% and Health Care dropped 1.35%. These differences underline that a sector can remain in Improving despite a negative daily return because the chart reflects relative strength and momentum coordinates rather than a single session’s percentage change.
Improving is worth monitoring because it can identify sectors whose momentum is recovering before relative strength turns positive. A move toward the upper-right quadrant would provide evidence that relative strength is improving as well as momentum. However, a position in Improving does not guarantee a transition into Leading; the direction and persistence of subsequent chart movements remain important.
Information Technology Remains in Weakening
Information Technology (XLK) was the only sector positioned in Weakening. Its endpoint sits to the right of the vertical midpoint but below the horizontal midpoint, indicating positive relative strength alongside negative momentum. Its separation from the cluster of sectors in Improving highlights a different momentum profile, even though its daily return was almost flat at -0.04%.
A sustained upward turn and a move above the horizontal midpoint would be needed for XLK to return to Improving and potentially progress toward Leading. Continued downward momentum could keep the sector in Weakening. The chart alone does not establish the cause of the momentum reading, so the focus should remain on the direction and persistence of the plotted trajectory rather than attributing it to one day’s market news.
Communication Services Remains in Lagging
Communication Services (XLC) was the only sector in Lagging. Its position below the horizontal midpoint and to the left of the vertical axis indicates negative momentum and negative relative strength. The latest plotted trajectory remains below the horizontal midpoint, suggesting that the sector has not yet demonstrated the recovery required to move into Improving.
XLC nevertheless gained 0.74% during the session. This contrast reinforces the distinction between daily price performance and relative momentum classification: a positive one-day return does not automatically shift a sector into a stronger quadrant. A sustained move upward and toward the right would provide clearer evidence that its relative position is recovering.
Bottom Line
The US sector momentum picture on 13 October 2026 was dominated by Improving, with nine sectors in that quadrant, Communication Services in Lagging and Information Technology in Weakening. No sector was positioned in Leading. Utilities displayed a comparatively strong momentum reading within Improving, while XLK’s position reflected negative momentum despite positive relative strength. XLC remained the only sector with both weak relative strength and weak momentum.
The next chart update should focus on whether the Improving sectors move toward positive relative strength, whether XLK rises above the horizontal midpoint, and whether XLC begins a sustained upward trajectory. These developments will help determine whether the current configuration signals broader improvement or remains a temporary momentum pattern.

 Oct 28, 2026





 Please wait processing your request...