
 CA
 NZ
 UK
 AU
 IND

 US

 Share
 X (Formerly Twitter)
 Whatsapp
 Facebook
 LinkedIn
 Telegram
 Email This Article
 Copy Link
 Summarize with AI
 Chat GPT
 Perplexity

Key Momentum Shifts
- Energy (XLE) occupies Leading and sits furthest to the right on the chart, indicating the strongest relative positioning among the eleven US sectors.
- Consumer Staples (XLP), Utilities (XLU), Healthcare (XLV), Consumer Discretionary (XLY), Materials (XLB), Financials (XLF) and Real Estate (XLRE) also occupy Leading.
- Communication Services (XLC) and Industrials (XLI) are positioned in Improving, with their latest plotted positions remaining above the horizontal midpoint but to the left of the vertical axis.
- Technology (XLK) remains the only sector in Lagging, positioned substantially below the horizontal midpoint and well to the left of the chart's centre.
- No sector is clearly positioned in Weakening at the latest plotted point, although some Leading sectors show trajectories that Warrant monitoring for signs of fading momentum.
- The chart highlights a substantial divergence between Energy's strong relative positioning and Technology's deeply negative position.
The latest Relative Performance Visualization for 23 October 2026 shows seven US sectors in Leading, two in Improving and Technology as the sole sector in Lagging. Energy, Consumer Staples, Utilities, Healthcare, Consumer Discretionary, Materials, Financials and Real Estate occupy the upper-right quadrant, while Communication Services and Industrials remain in Improving. Technology stands apart in the lower-left quadrant, and no sector is clearly located in Weakening.
This configuration indicates that relative momentum remains concentrated among the Leading sectors, with Energy maintaining the strongest rightward position. However, the trajectories suggest that Leadership is not uniform: some sectors remain well positioned, while others display signs of momentum moderation. Technology continues to be the most significant outlier, with its deeply negative chart position highlighting a substantial relative-momentum disadvantage.
US Sector Momentum Quadrants
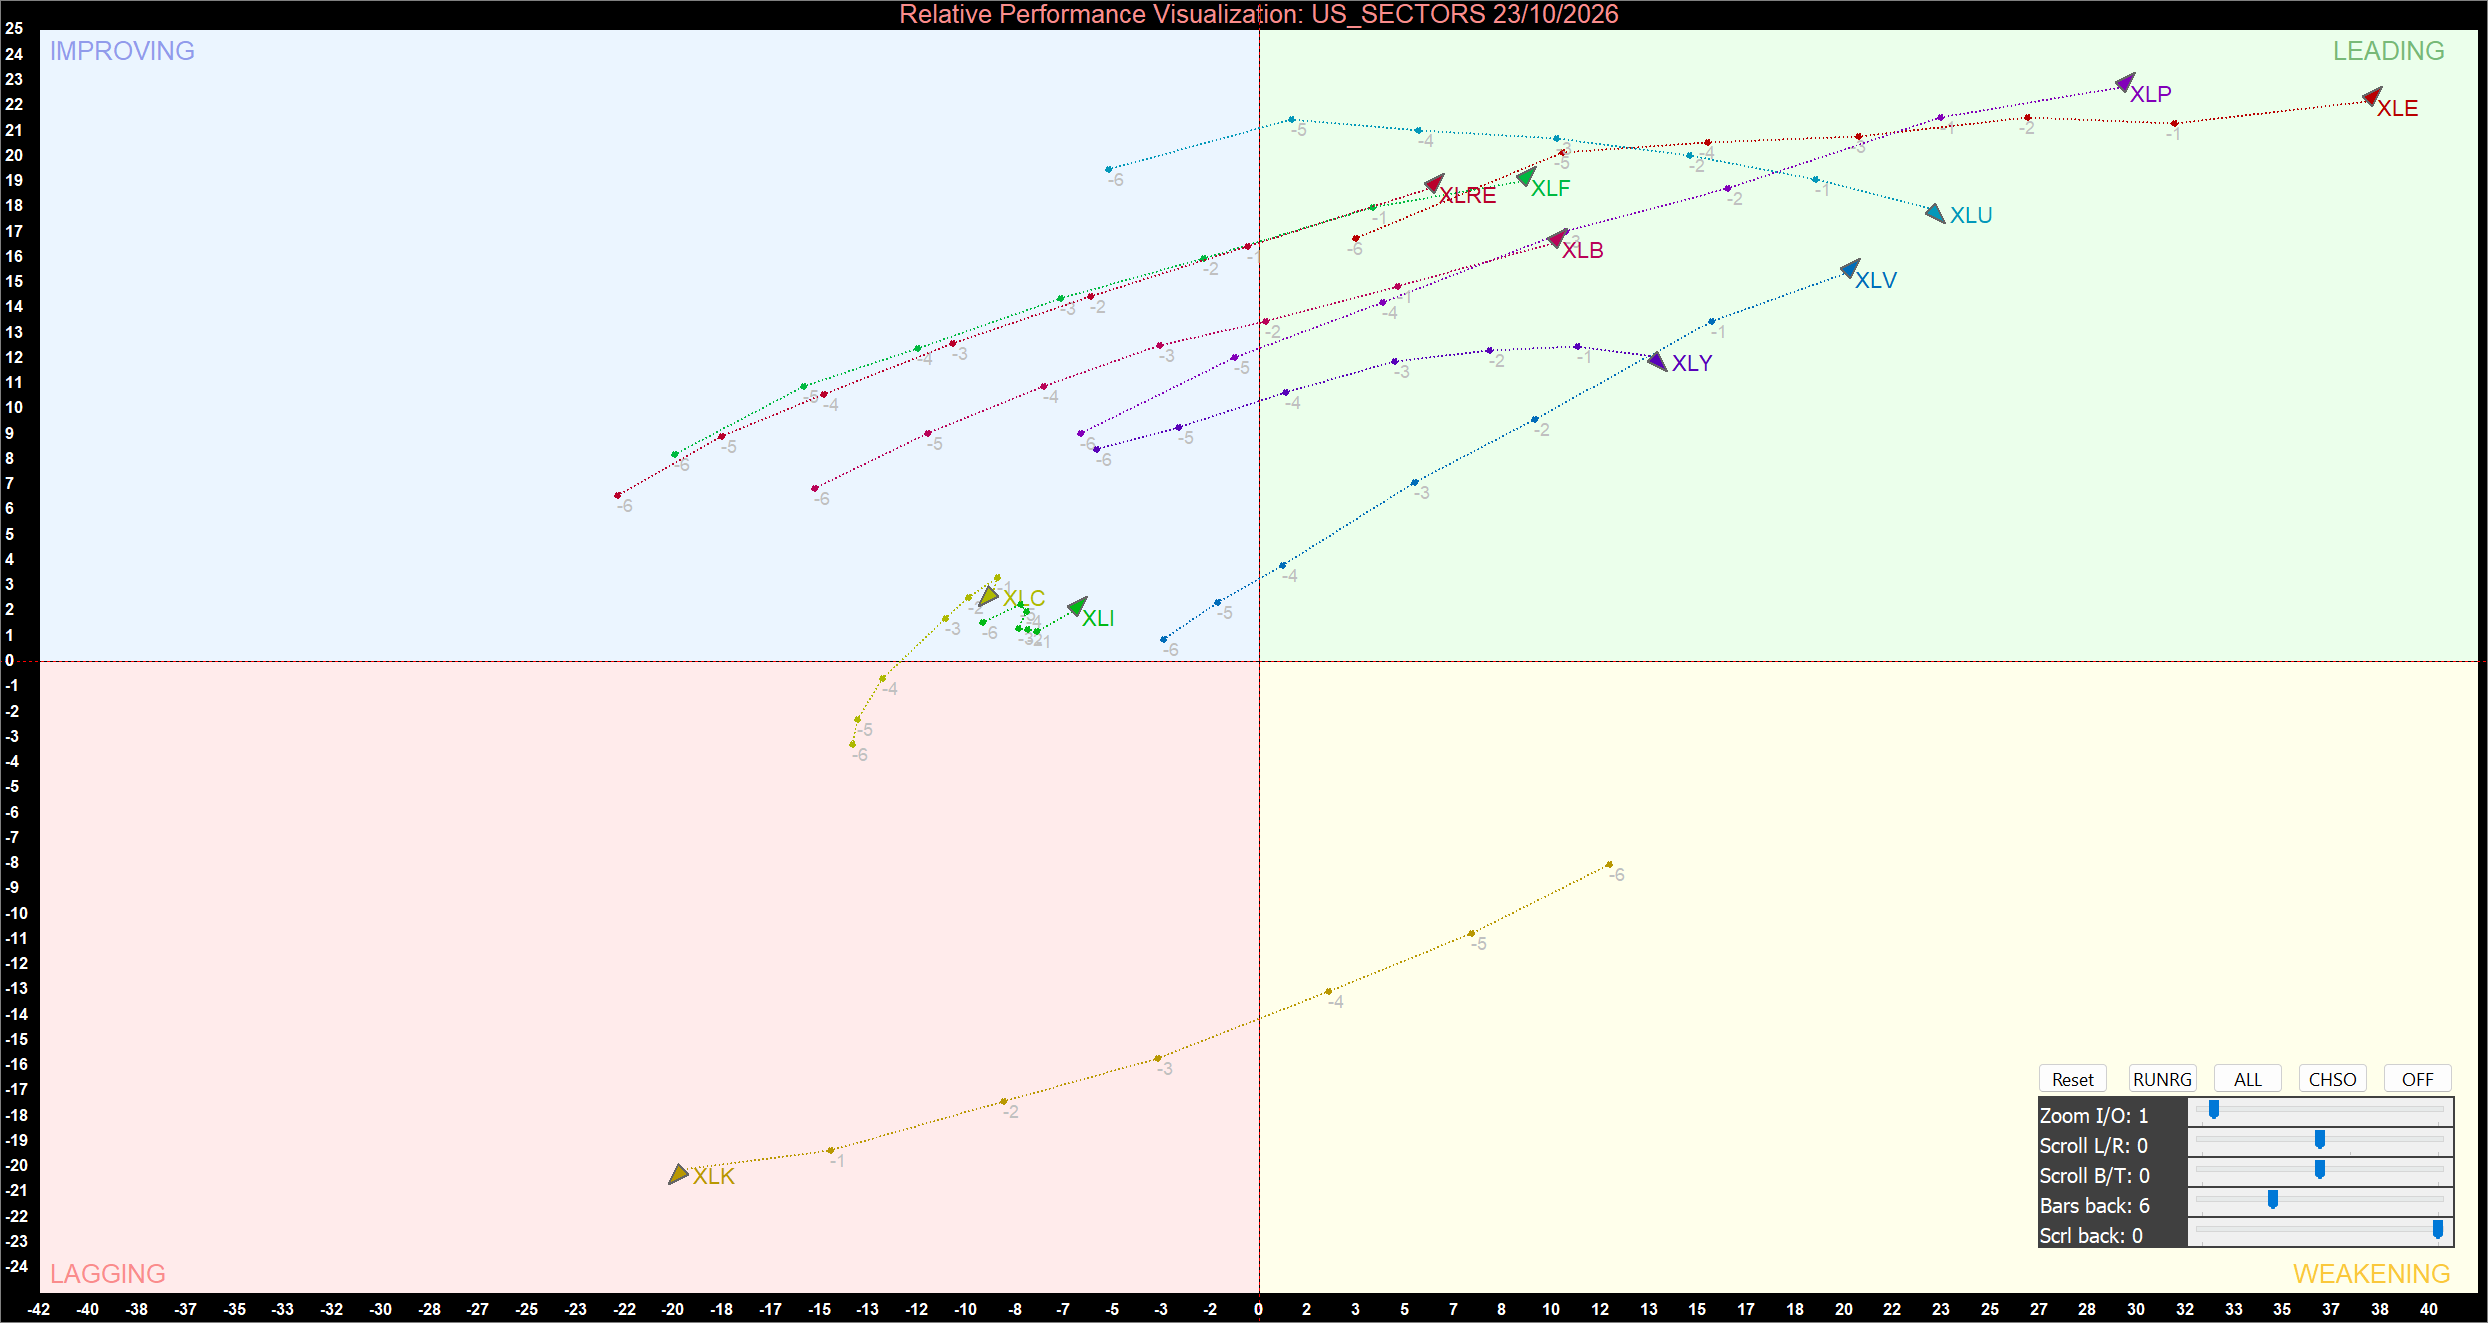
US Sector Relative Momentum Chart at the closing price of 23/10/2026. Powered by: amibroker.com.
Leading Quadrant
Energy (XLE), Consumer Staples (XLP), Utilities (XLU), Healthcare (XLV), Consumer Discretionary (XLY), Materials (XLB), Financials (XLF) and Real Estate (XLRE) occupy the Leading quadrant. Their positions to the right of the vertical midpoint and above the horizontal axis indicate relatively strong momentum and relative strength. Energy remains the furthest-right sector, making it the clearest leader on the current chart.
Consumer Staples is also positioned prominently in the upper-right area, while Utilities and Healthcare maintain positive relative positioning despite differences in their recent trajectories. Consumer Discretionary remains within Leading but shows a trajectory that warrants attention because momentum appears to be moderating. Materials, Financials and Real Estate occupy the upper-right region closer to the central boundaries, indicating that their positions are less extended than those of the strongest leaders.
Quadrant membership alone does not guarantee continued outperformance. The direction of each sector's trajectory remains important, particularly when an endpoint begins to turn back towards the centre of the chart. Energy's strong position contrasts with the more mixed momentum patterns visible among several other Leading sectors.
Improving Quadrant
Communication Services (XLC) and Industrials (XLI) occupy Improving. Their latest plotted positions remain above the horizontal midpoint but to the left of the vertical axis, indicating improving momentum readings while relative strength remains below the chart's central benchmark.
Both sectors are clustered relatively close to the horizontal axis and remain much nearer to the centre than Energy or the other established Leading sectors. Their position suggests that momentum has improved from earlier weaker readings, but they have yet to establish the stronger relative positioning associated with Leading. Sustained movement to the right would provide stronger confirmation that their relative performance is improving sufficiently to join the Leading group.
Lagging Quadrant
Technology (XLK) remains the only sector in Lagging and is positioned substantially below the horizontal midpoint and far to the left of the vertical axis. This Placement indicates weak relative strength and a materially negative momentum reading compared with the broader sector group.
Although the historical trajectory shows some movement back towards the centre at earlier points, the latest position remains deeply negative. Technology therefore continues to represent the clearest area of relative weakness on the chart. A sustained upward and rightward movement would be needed to indicate a meaningful improvement in its momentum profile.
Bottom Line
The 23 October 2026 momentum chart shows broad leadership across seven sectors, with Energy maintaining the strongest relative position. Communication Services and Industrials are improving but have yet to establish positive relative strength, while Technology remains deeply lagging. The next directional movements will be important: sustained strength among the Leading sectors would reinforce the existing rotation, whereas weakening trajectories could signal that leadership is becoming less durable.


 Oct 27, 2026





 Please wait processing your request...