
Key Highlights
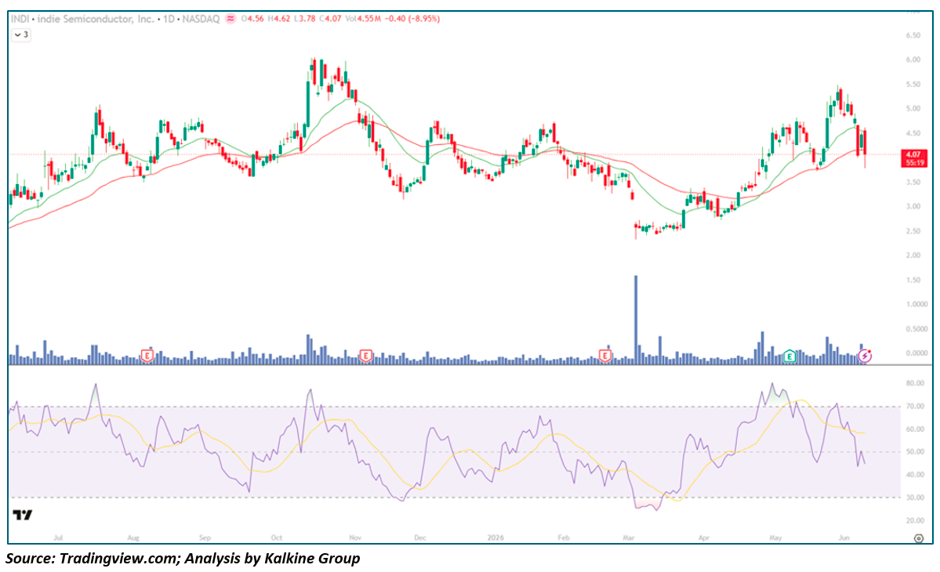
- INDI closed at $4.07, dropping -$0.40 (-8.95%) on elevated Volume of 4.55M shares
- Price traded between $3.78 and $4.62 intraday, reflecting sharp intraday selling pressure
- Stock has broken back below both EMA-21 (~$4.20) and EMA-50 (~$3.50 area), invalidating the recent recovery structure
- RSI-14 has rolled over sharply from near overbought (80) in early May to current ~45 and declining, confirming momentum deterioration
- Volume spiked on the recent Earnings marker ("E"), suggesting a post-earnings sell-off is driving the current weakness
- INDI has made multiple attempts to break above $5.50–$6.00 over the past year, each failing and resolving lower — a pattern of persistent overhead resistance
- Despite today's selloff, the stock remains well above its Feb 2026 lows of ~$2.50, preserving the broader recovery thesis for patient bulls
Trend Structure: Cyclical Oscillation Within a Defined Range
Phase 1 — Distribution From Summer Highs (Jul – Nov 2025)
INDI entered the visible chart period in a modest uptrend before rolling over sharply from the October–November peak near $5.50–$6.00:
- Price made a clear lower high following the November earnings marker, signalling distribution
- EMA-21 crossed below EMA-50 during this phase, establishing a bearish Moving Average structure
- RSI peaked near 70 before rolling into a prolonged decline toward oversold territory
- Volume expansion accompanied the initial breakdown, confirming institutional selling rather than passive drift
Phase 2 — Prolonged Base & Accumulation (Dec 2025 – Feb 2026)
INDI entered an extended bottoming process through the turn of the year:
- Price compressed into the $2.50–$3.50 range, with the February 2026 low near $2.50 representing the critical Demand zone
- RSI touched deeply oversold levels (~28–30) — the most extreme reading across the entire visible chart history
- A massive volume spike around the March earnings event signalled a potential Capitulation low and the beginning of institutional re-engagement
- EMA-21 and EMA-50 began flattening, consistent with base formation dynamics
Phase 3 — Recovery Rally & Failed Breakout Attempt (Mar – May 2026)
The stock staged an impressive recovery from its lows, nearly doubling off the February bottom:
- Price reclaimed both EMA-21 and EMA-50 in quick succession, with both moving averages turning higher
- RSI surged from oversold extremes back toward the 75–80 zone, reflecting genuine momentum restoration
- The May push toward $5.20–$5.50 represented the most promising breakout attempt since the prior year's highs
- However, price once again failed to clear the $5.50 resistance ceiling that has now rejected INDI on multiple occasions, reinforcing the significance of this overhead Supply zone
Moving Averages: Bearish Recross Signals Renewed Vulnerability
EMA-21 (~$4.20)
- Price has broken back below the EMA-21 following today's -8.95% session, a near-term bearish signal
- The EMA-21 served as reliable dynamic support throughout the March–May recovery rally; losing it on elevated volume is a meaningful structural deterioration
- A recovery back above $4.20 on strong volume would be the minimum requirement to stabilise the short-term trend
EMA-50 (~$3.50)
- Still trending higher from the February base, providing medium-term structural support
- Represents the key line in the sand for the broader recovery thesis — bulls must defend this level on any further drawdown
- A close below EMA-50 would raise the probability of retesting the $2.50–$3.00 demand zone established during the winter base
The current moving average setup — price below EMA-21 but above rising EMA-50 — is a classic pullback-within-an-uptrend structure, though the magnitude of today's selloff demands caution before assuming the recovery is intact.
Momentum Analysis: RSI Deterioration Warrants Attention
RSI-14 has declined from a peak near 80 in early May to approximately 45 and falling, a rapid decompression that mirrors the price action perfectly:
- The RSI signal line (yellow) has now crossed above the RSI line, a near-term bearish momentum signal
- The current RSI trajectory is tracking the same path as the Nov–Dec 2025 deterioration that preceded the move to $2.50 lows
- However, RSI remains above the 40 level — a hold above this zone would suggest the pullback is corrective rather than the beginning of a new downtrend
- A bounce from the 40–45 RSI zone coinciding with price holding above EMA-50 would be the constructive outcome bulls need to see
Volume Analysis: Earnings-Driven Selling on Heavy Participation
Volume tells a nuanced story for INDI:
- Today's 4.55M share session represents elevated distribution volume, suggesting the post-earnings reaction is being driven by meaningful institutional selling
- The March capitulation spike remains the single largest volume event on the chart — that climactic selling likely marked the demand floor
- The recovery rally from March to May occurred on progressively increasing volume, which was constructive
- However, the most recent volume expansion has accompanied price deterioration, a warning sign that the rally phase may be transitioning into a distribution phase at the $5.00+ region
Key Technical Levels
Resistance Levels
- $5.50–$6.00 — major multi-test resistance ceiling; failed breakout zone
- $5.00 — psychological round number and near-term recovery target
- $4.20 — broken EMA-21 now acting as near-term resistance
Support Levels
- $3.78 — today's intraday low and immediate downside reference
- $3.50 — rising EMA-50 and key medium-term structural support
- $2.80–$3.00 — prior consolidation zone and secondary demand area
- $2.50 — February 2026 cycle low and ultimate Bull Market line in the sand
Scenario Analysis
- Bullish Recovery (Base Case for Patient Bulls) If INDI stabilises above EMA-50 (~$3.50) and RSI holds the 40 zone: → A re-test of the EMA-21 ($4.20) would be the first recovery milestone → Sustained momentum could re-establish a base for another attempt at the $5.00–$5.50 range → A decisive break and close above $5.50 would be the most significant bullish development in over a year
- Sideways Consolidation (Constructive Digestion) Price may range between $3.50–$4.50 while digesting the post-earnings selloff: → RSI mean-reverts to neutral while price coils above the rising EMA-50 → Reduced volume confirms cooling of selling pressure → This outcome would preserve the broader uptrend and set up the next leg higher
- Bearish Breakdown (Risk Case) A close below EMA-50 (~$3.50) on heavy volume would significantly raise the risk profile: → Downside could accelerate toward the $2.80–$3.00 demand zone → RSI would likely breach the 40 level, confirming renewed trend deterioration → A retest of the February $2.50 lows cannot be ruled out under this scenario
Conclusion: INDI at a Critical Juncture After Post-Earnings Flush
indie Semiconductor finds itself at a pivotal technical inflection point following today's sharp -8.95% post-earnings selloff. The stock's inability to break decisively above the $5.50 resistance zone — a level that has now rejected price on multiple occasions across the past year — remains the defining technical challenge for the bull case. Near-term, the rising EMA-50 (~$3.50) is the critical support to monitor; a hold there would preserve the recovery structure built since the February lows, while a breakdown would materially increase downside risk.
The framework going forward is clear:
- Above $4.20 (EMA-21) → short-term recovery intact, target $5.00–$5.50
- Above $5.50 → major structural breakout, multi-quarter bullish re-rating in play
- Below EMA-50 (~$3.50) → caution intensifies materially, risk of retesting February lows increases significantly
For risk-tolerant traders, the $3.50–$3.80 zone represents a defined-risk long opportunity with EMA-50 as the technical backstop — but confirmation of stabilisation before entry is prudent given today's heavy-volume rejection.


-Copy_06_09_2026_22_54_30_882342.jpg)
 Please wait processing your request...