
Key Highlights
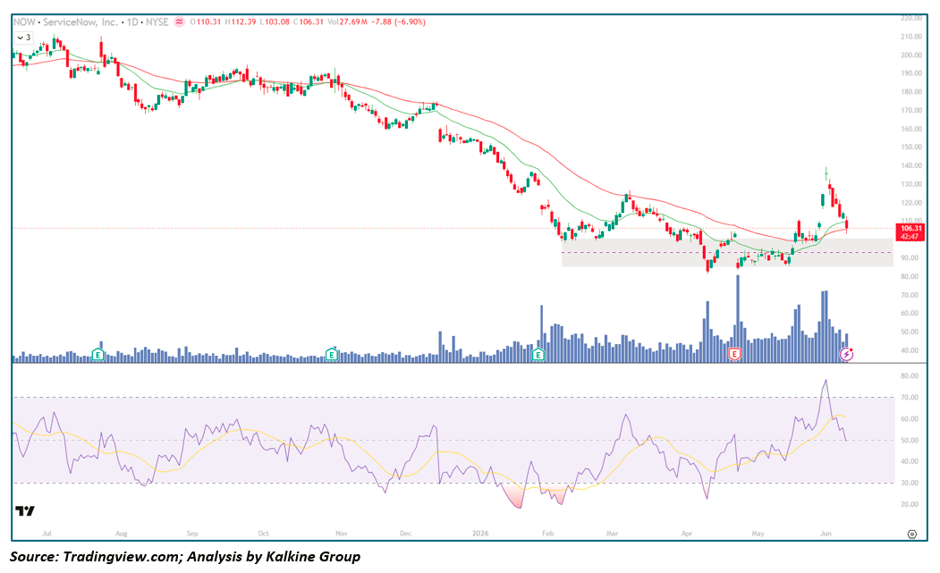
- NOW closed at $106.31, plunging -$7.88 (-6.90%) on exceptionally heavy Volume of 27.69M shares — one of the largest volume sessions in the visible chart history
- Price traded between $103.08 and $112.39 intraday, with the close near session lows reflecting sustained selling pressure throughout the entire day
- Stock has broken back below both EMA-21 (~$110) and EMA-50 (~$112), with both moving averages now converging and rolling over — a classically bearish structural deterioration
- RSI-14 has collapsed from a peak near 80 in late May back to approximately ~42 and falling, rapidly approaching oversold territory without yet showing any signs of stabilisation
- The stock has surrendered the entirety of its impressive April–May recovery rally from the $88 lows to the $140 highs in a matter of weeks — a devastating round-trip that signals aggressive institutional distribution at the highs
- Volume has been consistently elevated on down days throughout June, confirming that professional Capital is exiting rather than rotating
- The $88–$92 Demand zone established during the January–February 2026 base represents the ultimate technical line in the sand for the broader recovery thesis
Trend Structure: Prolonged Decline, False Dawn, and Renewed Vulnerability
Phase 1 — Extended Distribution &Amp; Primary Downtrend (Jul 2025 – Jan 2026)
NOW entered the visible chart period already in a well-established downtrend from the $210 highs, and the selling was methodical and relentless across the first half of the chart:
- Price declined in a steady staircase pattern from ~$210 in July 2025 to the eventual cycle low of ~$88 in January 2026 — a peak-to-trough decline of nearly 58% over six months
- EMA-21 remained persistently below EMA-50 throughout this phase, with both moving averages sloping steeply downward and acting as dynamic resistance on every attempted bounce
- Volume expanded materially on the November and January breakdown legs, confirming that institutional selling was the dominant force driving the decline rather than passive drift
- RSI repeatedly found temporary relief near the 30 zone before rolling back lower without ever sustaining a recovery above the 50 level — a hallmark of a stock entrenched in a genuine primary downtrend
- Multiple Earnings markers appeared during the decline with each failing to produce any lasting Reversal, underscoring the severity of the fundamental or macro headwinds weighing on the stock
Phase 2 — Capitulation Low, Base Formation & Accumulation (Jan – Mar 2026)
The January flush to ~$88 marked a significant inflection point, with the extreme RSI reading near 28 — the most oversold print visible across the entire chart — signalling potential exhaustion of the selling cycle:
- The $88–$92 zone attracted visible demand for the first time in months, with price beginning to stabilise and volume compressing — classic signs of selling exhaustion
- EMA-21 began flattening and eventually turned higher, breaking its multi-month downward slope for the first time since the July 2025 peak
- RSI recovered from the extreme oversold lows back toward the 50 zone, reflecting a genuine shift in the momentum balance between buyers and sellers
- The base formation between $88–$110 across February and March proved to be the coiling mechanism that fuelled the subsequent explosive recovery rally
Phase 3 — Recovery Rally, Failed Breakout & Distribution (Apr – Jun 2026)
The April–May recovery was explosive and initially appeared to confirm a genuine trend reversal:
- Price surged from the $88 base all the way to ~$140 — a near 59% advance in under six weeks — the most powerful recovery move in the entire visible chart
- EMA-21 crossed back above EMA-50 during this phase, producing a bullish Moving Average crossover that suggested the primary downtrend had been broken
- RSI reached approximately 80 during the May peak — deep overbought territory on a Daily Chart, a level that historically warrants caution around near-term sustainability
- However, the $138–$140 zone proved to be a formidable resistance ceiling, with sellers overwhelming buyers at the first meaningful test of the former distribution area
- The reversal from $140 has been sharp, sustained, and high-volume — characteristics of institutional distribution rather than a healthy pullback within an uptrend
Moving Averages: Bearish Recross Signals Structural Deterioration
EMA-21 (~$110)
- Price has broken back below the EMA-21 on today's -6.90% session, erasing weeks of recovery work in a single day
- The EMA-21 served as reliable dynamic support throughout the April–May rally; losing it decisively on record volume is a meaningful near-term bearish signal
- The slope of the EMA-21 has now flattened and appears to be rolling over — a recovery back above $110 on strong volume is the minimum requirement to stabilise the short-term structure
EMA-50 (~$112)
- The EMA-50 has also been surrendered and is beginning to flatten after its brief upward turn during the recovery phase
- Price trading below both converging moving averages places the technical structure firmly in the bearish camp until proven otherwise
- A confirmed close back above $112 would be required to suggest the EMA-50 can transition from resistance back to support
The $88–$92 Demand Zone
- This remains the ultimate medium-term support reference — the level that defined the cycle low and where the most significant accumulation occurred
- A retest of this zone cannot be ruled out under the current trajectory, and how price behaves on any approach to $88–$92 will be the most important technical event for NOW over the coming weeks
Momentum Analysis: RSI Deterioration Demands Caution
RSI-14 has declined from a peak near 80 in late May to approximately 42 and falling — a dramatic decompression that mirrors the price action precisely:
- The velocity of the RSI decline is particularly concerning; it has moved from deeply overbought to near-oversold in under three weeks, reflecting a genuine momentum reversal rather than a gradual cooling
- The RSI signal line (yellow) has crossed above the RSI line, adding a short-term bearish momentum confirmation to the picture
- The current RSI trajectory closely mirrors the December 2025 deterioration that preceded the final breakdown leg to the $88 lows — a historical precedent that warrants serious attention
- A stabilisation and recovery of RSI back above the 50 level while price holds above the $100 psychological support would be the most encouraging scenario for bulls attempting to defend the recovery
Volume Analysis: Heavy Distribution Raises Red Flags
Volume tells an unambiguous story in the current phase of NOW's chart:
- Today's 27.69M share session represents one of the highest volume prints in the entire visible chart — the kind of participation that signals institutional-scale repositioning rather than retail selling
- The recovery rally from February to May occurred on progressively increasing volume, which was constructive and appeared to validate the move
- However, the most recent volume surge has arrived decisively on the downside — the classic distribution signature of institutions selling into retail strength
- The volume spike on the April earnings marker was the single largest session on the chart and coincided with the peak of the recovery rally, raising the possibility that the earnings event acted as a distribution catalyst rather than a continuation trigger
Key Technical Levels
Resistance Levels
- $110–$112 — broken EMA-21 and EMA-50 now acting as immediate overhead resistance
- $120–$125 — mid-range recovery zone and prior consolidation area
- $138–$140 — major failed breakout zone and primary resistance ceiling
Support Levels
- $103.08 — today's intraday low and immediate downside reference
- $100 — critical psychological round number and near-term bull/bear line
- $92–$95 — secondary demand zone from the prior base structure
- $88–$90 — January 2026 cycle low and ultimate structural support
Scenario Analysis
- Bullish Stabilisation (Base Case for Patient Bulls) If NOW can hold above the $100 psychological level and RSI stabilises near 40: → A recovery back above EMA-21 ($110) would be the first signal that the post-earnings flush has exhausted itself → Sustained momentum above $112 (EMA-50) would restore the medium-term bull case and open a path back toward the $120–$125 range → The fundamental quality of ServiceNow's enterprise software Franchise provides a valuation floor that should attract buyers on any approach to the $88–$95 demand zone
- Sideways Consolidation (Constructive Digestion) Price may stabilise between $100–$112 while the post-earnings selling pressure dissipates: → RSI mean-reverts toward the 45–50 zone while price coils above the $100 level → Volume normalises, confirming that the aggressive distribution phase has run its course → This outcome would preserve the broader recovery structure and set up a more sustainable re-entry opportunity toward the $120+ range
- Bearish Breakdown (Risk Case) A close below $100 on elevated volume would materially escalate the downside risk profile: → Selling pressure could accelerate toward the $92–$95 secondary support zone → A failure there would bring the $88–$90 cycle low back into direct focus — a full round-trip of the entire recovery rally → RSI would almost certainly enter the 30–35 oversold zone under this scenario, potentially triggering a mechanical bounce but not necessarily a trend reversal
Conclusion: NOW at a Pivotal Crossroads Following Historic Volume Selloff
ServiceNow finds itself at a critical technical juncture following today's extraordinary -6.90% session on record volume. The stock's failure to hold the $138–$140 resistance zone and the subsequent rapid unwinding of the entire recovery rally raises legitimate questions about whether the January lows truly marked a durable cycle bottom or merely a temporary reprieve within a larger bearish structure. The $100 psychological level is now the immediate battleground — a hold here with declining volume and RSI stabilisation would suggest the flush is complete; a break below it would open a direct path back toward the cycle lows.
The framework going forward is clear:
- Above $112 (EMA-50) → recovery structure intact, target $120–$125
- Above $140 → major structural breakout, full trend reversal confirmed
- Below $100 → caution intensifies sharply, risk of retesting $88–$92 cycle lows escalates significantly
For value-oriented investors, the $92–$100 zone represents a historically defined demand area where the risk-reward skews more favorably — but given today's volume and momentum profile, confirmation of stabilisation before establishing any long position is not just prudent, it is essential.


-Copy_06_09_2026_22_54_30_882342.jpg)
 Please wait processing your request...