
Key Highlights
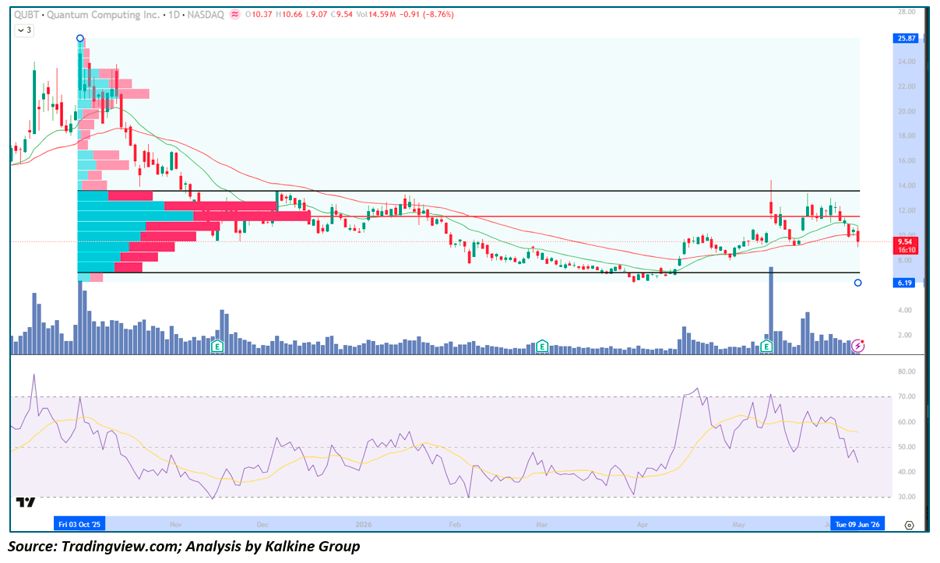
- QUBT closed at $9.53, plunging -$0.92 (-8.85%) on Volume of 14.58M shares, with an intraday range of $9.07–$10.66 reflecting a close near session lows and a complete rejection of the $10+ handle
- Price has broken below both EMA-21 (~$10.50) and EMA-50 (~$10.20), erasing the constructive Moving Average structure built since the March recovery and placing the stock back in bearish moving average territory
- The Volume Profile displayed on the left side of the chart reveals the precise price levels of maximum historical trading activity — and today's close sits directly at one of the most critical volume nodes in the stock's history
- RSI-14 has declined from its double peak near 70–75 in April and May back to approximately ~43 and falling, approaching the neutral-to-bearish threshold in a trajectory that mirrors the October–November 2025 deterioration
- QUBT has traced the most extreme boom-bust cycle visible across all the charts reviewed — peaking near $25–$26 in October 2025 before collapsing approximately 63% to the $7–$8 base by early 2026
- The two bold horizontal black lines at approximately $7.50 and $13.50 define the absolute boundaries of the current trading range — a range that has contained every meaningful price move since the October 2025 distribution began
- The stock's entire post-blow-off history can be characterised as a prolonged battle between these two horizontal boundaries, with today's decline threatening to return price to the lower half of this established range
Understanding the Volume Profile (Fixed Range) Displayed on the Chart
The Volume Profile on the left side of the chart is one of the most sophisticated and informative technical tools available — it shows the distribution of all trading volume across every price level over the selected period, displayed as horizontal bars extending leftward from the price axis. Unlike standard volume (which shows how much was traded over time), the Volume Profile reveals where the most trading activity occurred in price terms. Here is a complete explanation of what the QUBT profile is telling us:
What the Bars Represent Each horizontal bar in the profile corresponds to a specific price level, with the bar's length representing the total volume traded at that price. Longer bars mean more total shares changed hands at that price — shorter bars mean relatively little activity occurred there. The profile uses two colours: cyan/blue bars represent volume that occurred on up-days (buying volume dominant), and pink/magenta bars represent volume that occurred on down-days (selling volume dominant). This colour distinction reveals not just where trading concentrated but whether that concentration was driven by buyers or sellers.
Point of Control (POC) — The Longest Bar (~$11.50–$12.50) The longest bar in the entire Volume Profile — visible as the dominant cyan and pink combined bar in the $11–$13 range — represents the Point of Control (POC): the single price level where the greatest total volume was traded across the entire measured period. The POC at approximately $11.50–$12.50 is the most significant price reference in the entire profile because it represents the level of maximum market agreement — where the most transactions between buyers and sellers were completed. In practical terms, the POC acts as a powerful magnet; price gravitates toward it from above and below, and it frequently acts as support when price is above it and resistance when price is below it. The fact that today's close at $9.53 sits below the POC confirms that price is currently trading in the "value rejection" zone — the area that the market collectively agreed was too cheap during the measurement period.
Value Area High (VAH) — ~$13.50 (Upper Black Horizontal Line) The upper black horizontal line at approximately $13.50 represents the Value Area High — the upper boundary of the price range where approximately 70% of all historical volume was transacted. This is one of the most universally respected levels in volume profile analysis because it defines the upper limit of "Fair Value" as determined by actual Market Participants. Price trading above the VAH represents premium territory; price trading below it (as QUBT currently is) indicates the stock is below the zone where the majority of historical transactions occurred. The VAH at $13.50 has acted as a visible resistance ceiling on multiple occasions across the post-blow-off consolidation, capping the May recovery rally and defining the upper boundary of the established range.
Value Area Low (VAL) — ~$7.50 (Lower Black Horizontal Line) The lower black horizontal line at approximately $7.50 represents the Value Area Low — the lower boundary of the price range where the bulk of historical volume concentrated. This is the most critical support reference in the Volume Profile framework for QUBT because it defines the absolute floor of established value. When price approaches the VAL, it is entering the zone of maximum historical buyer Demand — the level at which the preponderance of accumulated long positions were established. A hold above the VAL preserves the value area structure; a sustained break below it would signal that the market is repricing the stock below any level of prior established value, implying genuine structural deterioration of the Investment thesis.
Low Volume Nodes (LVNs) — The Thin Bars Between $8 and $9 The relatively short bars visible between approximately $8 and $9 represent Low Volume Nodes (LVNs) — price levels where very little historical trading occurred. LVNs are critical because they represent areas of price inefficiency — levels that price moved through quickly without establishing meaningful two-way activity. In practical terms, LVNs act as areas of low resistance; when price enters an LVN zone, it tends to move rapidly through it toward the next High Volume Node (HVN) or the Value Area boundaries. The LVN between $8–$9 is directly relevant today because today's intraday low of $9.07 is approaching this zone — if price breaks below $9 into the LVN, the lack of volume support could accelerate the decline rapidly toward the VAL at $7.50.
High Volume Node (HVN) — ~$11–$13 (The Dense Cluster) The dense concentration of volume between $11 and $13 represents the primary High Volume Node of the profile — a zone of maximum historical Liquidity and established fair value. HVNs act as powerful support and resistance because they represent price levels where both buyers and sellers were most active and most willing to transact. The current price at $9.53 sitting below this HVN confirms that the stock is trading in "discount" territory relative to where the market historically established value — a potentially attractive entry zone for value-oriented buyers, but also a warning that the market is currently unwilling to pay the prices at which most prior transactions occurred.
Colour Dominance Analysis The profile reveals an important asymmetry: the dominant cyan (buying volume) bars appear concentrated in the $10–$14 range, while the pink (selling volume) bars are more prominent at the extremes — particularly near the $20+ blow-off peak levels. This colour distribution confirms that the bulk of institutional accumulation occurred in the $10–$14 range during the post-blow-off base formation, while the extreme highs were characterised primarily by distribution selling. Current price at $9.53 sits just below the primary cyan accumulation zone — approaching but not yet at the maximum historical buying concentration.
Trend Structure: Blow-Off Peak, Structural Collapse, Extended Base, and Now Range Compression
Phase 1 — Parabolic Blow-Off Top & Catastrophic Collapse (Oct – Nov 2025)
QUBT entered the visible chart period in the final stages of an extraordinary speculative blow-off that produced the most extreme price action across all the Quantum Computing names reviewed:
- Price peaked near $25–$26 in early October 2025 — a valuation reflecting maximum quantum computing speculation — before collapsing in one of the most violent reversals on the chart
- The October peak coincided with an RSI reading near 80 — the most overbought condition in the stock's visible history — immediately preceding a collapse that saw price fall from $25 to $10 in under six weeks
- EMA-21 and EMA-50 both turned sharply lower and maintained steep downward slopes throughout the collapse, acting as dynamic resistance on every attempted bounce
- The Volume Profile's extreme pink (selling) bars near the $20–$25 range confirm that the blow-off peak was dominated entirely by distribution selling — there was no meaningful institutional accumulation at those levels, only speculative excess
Phase 2 — Extended Downtrend & Value Area Formation (Nov 2025 – Feb 2026)
Following the initial collapse, QUBT entered a grinding multi-month downtrend that established the Volume Profile's primary value area:
- Price declined from $14 in November 2025 all the way to the $7–$8 VAL zone by February 2026 — a further 45% decline from already-depressed levels
- The bulk of the Volume Profile's cyan accumulation bars were built during this phase — institutional buyers were gradually absorbing the float at the $9–$13 range as the prolonged decline created value
- RSI reached deeply oversold territory near the 30–35 zone during the February lows — the most extreme reading since the October blow-off — signalling genuine selling exhaustion
- The lower black horizontal line at $7.50 (VAL) proved to be the definitive floor, absorbing the final selling wave and establishing the foundation for the subsequent recovery
Phase 3 — Recovery Launch & Range Establishment (Mar – May 2026)
The March recovery — triggered by the Earnings catalyst visible in the volume spike — launched QUBT from the VAL toward the upper boundaries of the value area:
- Price surged from the $7–$8 VAL zone toward the $12–$14 range — advancing nearly 75% from the lows and approaching the VAH at $13.50
- EMA-21 crossed above EMA-50 for the first time since the November 2025 collapse, establishing a bullish moving average crossover within the context of the established value area
- RSI surged from oversold levels to dual peaks near 70–75 in April and May — the most powerful momentum readings since the October 2025 blow-off, reflecting genuine institutional re-engagement
- However, the upper black line VAH at $13.50 proved to be an impenetrable resistance ceiling, rejecting price on multiple occasions and confirming that Supply overwhelms demand at the upper boundary of the value area
Phase 4 — VAH Rejection, Correction & Return to POC (Jun 2026)
The failure to break above the VAH has triggered a correction that is now testing the integrity of the entire value area structure:
- Price has declined from the $13+ range back to $9.53 — approaching the lower half of the value area and threatening to exit below the POC at $11–$12.50
- Today's close at $9.53 sits in the LVN zone between the POC and the VAL — the area of lowest historical volume support, where price has historically moved quickly without establishing equilibrium
- The LVN zone between $8.50–$9.50 offers minimal support, creating the risk of a rapid decline toward the VAL at $7.50 if buying demand fails to emerge at the current level
Moving Averages: Bullish Structure Dismantled as Price Exits Value Area POC
EMA-21 (~$10.50)
- Price has broken below EMA-21 on today's session, the first decisive violation since the March recovery launch
- The EMA-21 at $10.50 aligns approximately with the lower boundary of the POC zone — its loss confirms that price has exited the area of maximum historical buying activity
- A recovery above $10.50 on strong volume would signal re-entry into the POC and restoration of near-term bullish momentum
EMA-50 (~$10.20)
- The EMA-50 is also now being tested and has been pierced on a closing basis, removing the medium-term moving average support that had defined the recovery structure
- The EMA-50 aligns with the lower POC zone and its loss on a closing basis is a meaningful bearish signal in the context of the Volume Profile framework
- Both moving averages now sit above current price in a declining alignment — the dual moving average resistance in the $10.20–$10.50 range is the immediate overhead challenge for any recovery attempt
Momentum Analysis: RSI Double Peak Confirms Distribution at VAH
RSI-14 at approximately 43 and declining delivers a clear and concerning message when viewed through the Volume Profile lens:
- The double RSI peak near 70–75 across April and May — while price failed to break above the VAH at $13.50 on both attempts — is a textbook bearish divergence confirming that institutional sellers were distributing into each recovery rally at the upper value area boundary
- The RSI signal line (yellow) has crossed above the RSI line, adding near-term bearish momentum confirmation
- The current RSI trajectory is heading toward the 35–40 zone — approaching but not yet at the oversold reading that accompanied the February VAL test
- A decline to RSI 30–35 while price tests the VAL at $7.50 would replicate the February low setup precisely and create QUBT's highest-conviction re-entry opportunity
Key Technical Levels — Integrated With Volume Profile
Resistance Levels
- $10.20–$10.50 — EMA-50 and EMA-21 convergence; immediate overhead resistance
- $11.50–$12.50 — Point of Control (POC); primary volume-based resistance above current price
- $13.50 — Value Area High (VAH) and upper black horizontal line; definitive range resistance
Support Levels
- $9.07 — today's intraday low; immediate reference
- $8.50–$9.50 — Low Volume Node (LVN); minimal support, fast-moving zone
- $7.50 — Value Area Low (VAL) and lower black horizontal line; maximum historical demand floor
- Sub-$7.50 — below established value area; uncharted territory and catastrophic bear scenario
Scenario Analysis
- POC Reclaim & Value Area Re-Entry (Bull Case) If QUBT stabilises near $9–$9.50 and recovers back above the POC ($11–$12.50) on strong volume: → The LVN zone would be traversed quickly as buying absorbs the thin supply between $9.50 and $11 → Re-entry into the POC zone would restore the medium-term bull case and set up another attempt at the VAH ($13.50) → A decisive break above the VAH on high volume would represent the most significant bullish development in QUBT's post-blow-off history — a genuine value area breakout targeting the $15–$18 range
- VAL Retest (Painful But Structurally Survivable) Price moves through the LVN quickly and retests the VAL at $7.50: → The LVN's lack of support accelerates the decline but the VAL's accumulated buying history provides the absorbing floor → RSI declining to 30–35 at VAL support would create the most powerful oversold-at-maximum-volume-support configuration since February 2026 → A successful VAL hold and recovery back above the POC would create the strongest base structure in the stock's post-blow-off history
- VAL Breakdown (Catastrophic Bear Case) A sustained close below $7.50 on elevated volume would be the most bearish possible outcome: → The entire established value area would be violated, implying the market is repricing QUBT below any level of prior institutional accumulation → No meaningful Volume Profile support exists below $7.50 — price would be in entirely uncharted territory → This scenario would suggest the quantum computing pure-play thesis has been fundamentally re-priced toward near-zero commercial value
Conclusion: QUBT's Volume Profile Reveals the True Stakes of the Current Correction
Quantum Computing Inc. presents one of the most analytically rich Volume Profile setups across all the charts reviewed today. The fixed range profile reveals with precision that today's close at $9.53 sits in the Low Volume Node between the POC and the VAL — the exact zone where historical buying support is thinnest and where price has consistently moved most rapidly without establishing equilibrium. This is the most dangerous technical location in the entire value area for a long position established at higher levels — below the POC where maximum buying historically occurred, above the VAL where the deepest demand sits, and in the thin LVN zone that offers virtually no friction to further downside.
The framework going forward integrates Volume Profile and Technical Analysis into a single clear structure:
- Above $10.50 (EMA-21 + POC lower boundary) → value area re-entry, near-term bull case restored
- Above $13.50 (VAH) → value area breakout, most bullish development since October 2025
- Hold $7.50 (VAL) + RSI ~30 → maximum historical demand floor, highest-conviction long entry
- Below $7.50 (VAL) → value area breach, uncharted territory, fundamental reassessment required
For technically sophisticated quantum computing investors, the current LVN location demands extreme caution — the absence of volume support in the $8.50–$9.50 zone means that if buying does not emerge immediately at the current level, the path to the VAL at $7.50 could be traversed with alarming speed.


-Copy_06_09_2026_22_54_30_882342.jpg)
 Please wait processing your request...